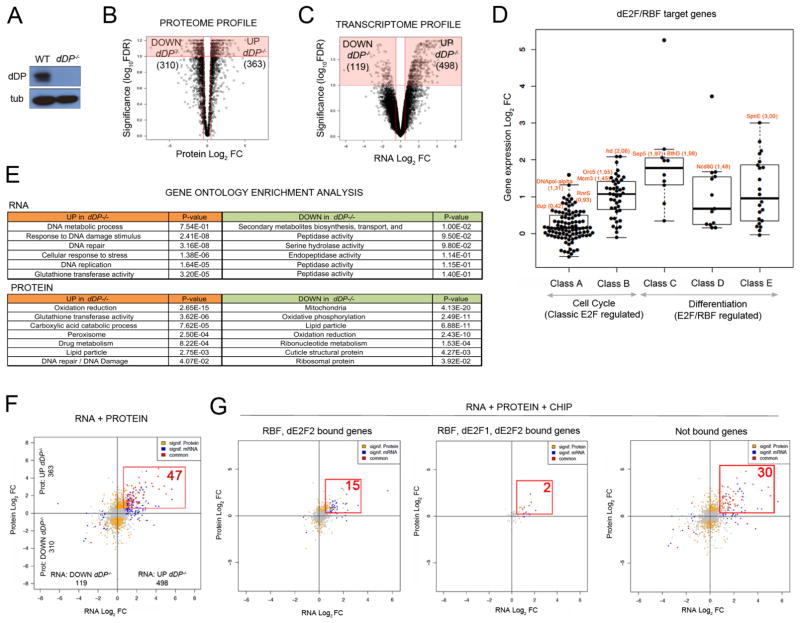
Figure 1. Loss of E2F activity drives proteome and transcriptome changes in vivo.
A: dDP blot of WT and dDP−/− larvae; tubulin, loading control. Volcano plot of Log2 FC between WT and dDP−/− proteomes (B) and transcriptomes (C) (significant changes in red). D: Increased expression of dE2F/RBF targets in dDP−/− larvae. E: GO analysis of RNA and protein datasets. Upregulated (orange) and downregulated (green) representative terms, sorted by descending significance. F: Integrated RNA/Protein data: 47 hits (red) significantly increase in RNA and protein level (compared to 6 significantly decreasing targets). Significant changes in RNA or protein are color coded in blue and yellow, respectively. Not significant changes are plotted in grey. G: ChIP/RNA/Protein plots. Subsets of changing hits in RNA/protein levels (red): RBF/dE2F2-bound (15), RBF/dE2F1/dE2F2-bound (2) and indirect target genes (30).

