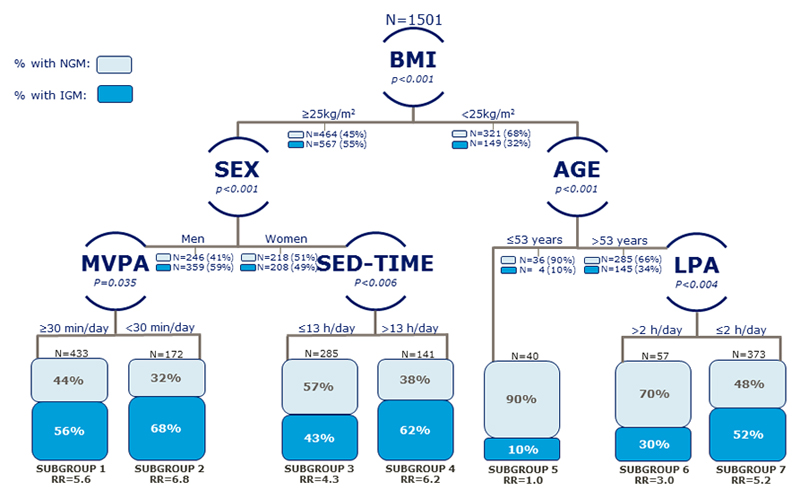
Figure 1.
The Decision Tree depicts seven subgroups that emerged from the interplay/combination between retained physical activity determinants and sex, age and BMI. Following every split in each subgroup, the corresponding prevalence is given for normal glucose metabolism (NGM; light turquois) vs. impaired glucose metabolism (IGM; dark turquois). The relative risk of IGM in each subgroup is in reference to the subgroup with the lowest risk of IGM (subgroup 5).
BMI, body mass index; LPA, light intensity physical activity (1.5-3.0METs); MVPA, moderate-to-vigorous physical activity of ≥ or < 30min (≥ 3.0 METs); SED-time, sedentary time while awake (≤ 1.5 MET, subtracting sleep); RR, relative risk.

