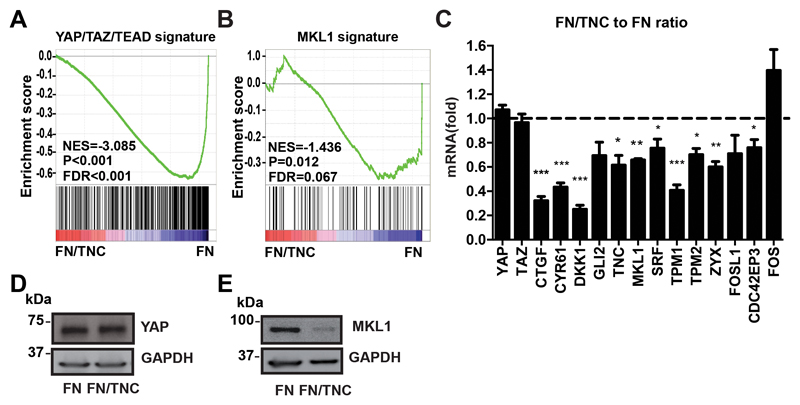
Figure 1. Impact of TNC on MKL1 and YAP target gene expression.
Gene Set Enrichment Analysis reveals a significant anti-correlation between TNC and a YAP/TAZ (A) and a MKL1/SRF (B) gene expression signature, respectively. The Normalized Enrichment Score (NES) and the False Discovery Rate (FDR) q-value assessing the significance of enrichment are indicated. (C) Gene expression by qPCR of selected genes in KRIB cells upon growth on FN or FN/TNC (n = 9) is expressed as relative ratio of values on FN/TNC versus FN. (D, E) Immunoblotting for YAP and MKL1 in KRIB cells on FN or FN/TNC. In all figures n = 9 and n = 6 represents 3 independent experiments with 3 replicates and 2 replicates, respectively. Mean ± SEM.

