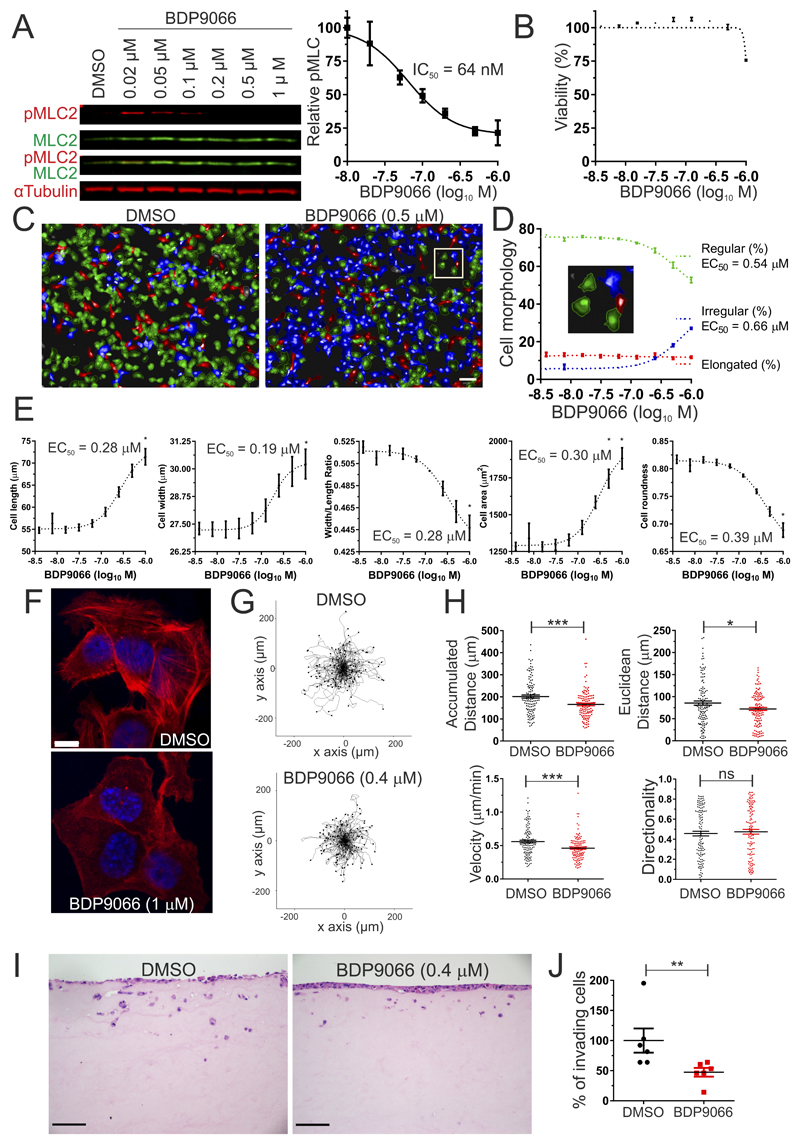
Figure 6. BDP9066 affects MLC2 phosphorylation, morphology, migration and invasion of human SCC12 squamous cell carcinoma.
(A) Western blots (left) showing dose dependent inhibition (right) of MLC2 phosphorylation by BDP9066 in SCC12 cells. Results shown are means ± SEM from 3 independent replicates. (B). SCC12 viability as a function of BDP9066 concentration after 24 hours treatment. Results shown are means ± SEM from 3 independent replicates. (C). High content analysis of SCC12 morphology following treatment with DMSO vehicle or 0.5 µM BDP9066 for 2 hours. Multiparametric analysis was used to define regular (green), elongated (red) and irregular (blue) SCC12 cell morphologies. Scale bar represents 100 µm. (D) Percentages of each SCC12 cell shape as functions of BDP9066 concentration after 2 hours treatment. Results shown are means ± SEM from 3 independent replicates. (E) Individual SCC12 cell morphology parameters (cell length, cell width, width/length ratio, cell area, cell roundness) as functions of BDP9066 concentration after 2 hours treatment. Results shown are means ± SEM from 3 independent replicates. (F). Representative images of phalloidin-stained filamentous actin structures in SCC12 cells treated with DMSO or 1 μM BDP9066 for ~18 hours. Scale bar = 10 µm. (G). Tracks of SCC12 cell migration (120 cells) treated with DMSO (left) or 0.4 μM BDP9066 (right) over 6 hours. Each line represents the path of a single cell from the origin, with final position indicated by a dot. (H). Accumulated distance, Euclidean distance, velocity and directionality of SCC12 cells treated with DMSO or 0.4 μM BDP9066 for each tracked cell over 6 hours. Results shown are means ± SEM from 120 individual cells. Two tailed unpaired t-tests were used to determine significance (* = p<0.05, *** = p<0.001). (I). Representative images of organotypic invasion by SCC12 cells cultured with medium supplemented with DMSO (left) or 0.4 μM BDP9066 (right). Scale bars represent 100 µm. (J). Percentage of invading SCC12 cells in organotypic invasion assays following treatment with DMSO or 0.4 μM BDP9066. Results shown are means ± SEM from 6 independent replicates. Two-tailed Mann-Whitney test of significance (** = p<0.01).

