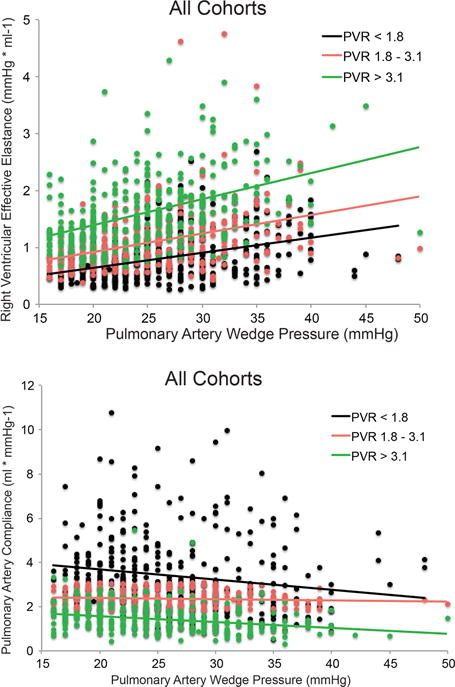
Figure 3.

A. Distribution of pulmonary Ea values and their respective regression lines as a function of PAWP into tertiles of PVR in combined cohort of patients with pulmonary hypertension due to left heart disease. Pulmonary Ea increased as PAWP increased in all tertiles of PVR. When compared to the highest PVR tertile, the two lower PVR tertiles can have similar or even higher pulmonary Ea at significantly elevated PAWP levels. B. Distribution of PAC as a function of PAWP into tertiles of PVR in the combined cohorts of patient with pulmonary hypertension due to left heart disease. Similarly, patients in the two lower PVR tertiles had similar or even lower PAC compared to the higher PVR tertile at significantly elevated PAWP.
