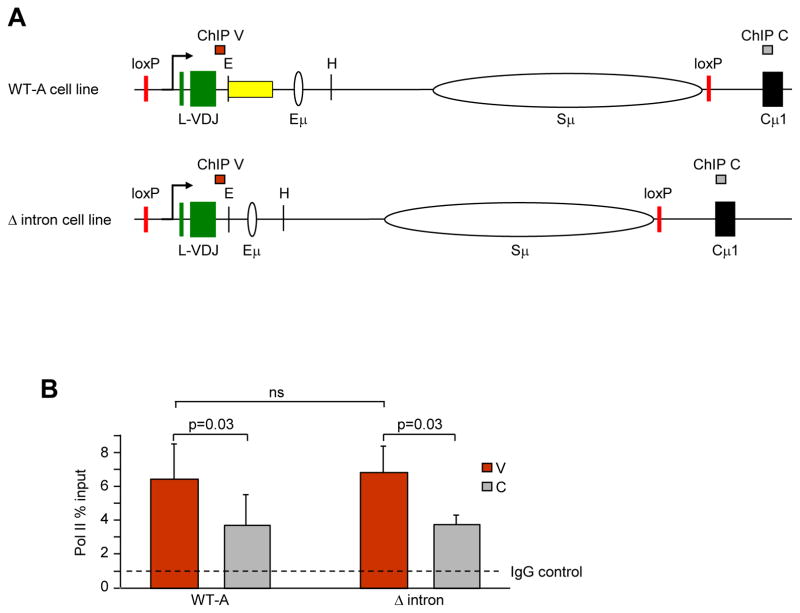
Fig. 4.
Pol II abundance in V and C regions as detected by ChIP. A) Position of V (red bar) and C (gray bar) primer sets within the WT-A and Δ intron cell lines. B) ChIP assays for Pol II and IgG from 4 independent experiments with 1–2 clones per strain per experiment. The dotted line shows the level of Pol II using nonspecific IgG. Error bars represent the standard error of the mean. Significance was measured using one-tailed paired student t-test; ns, not significant.

