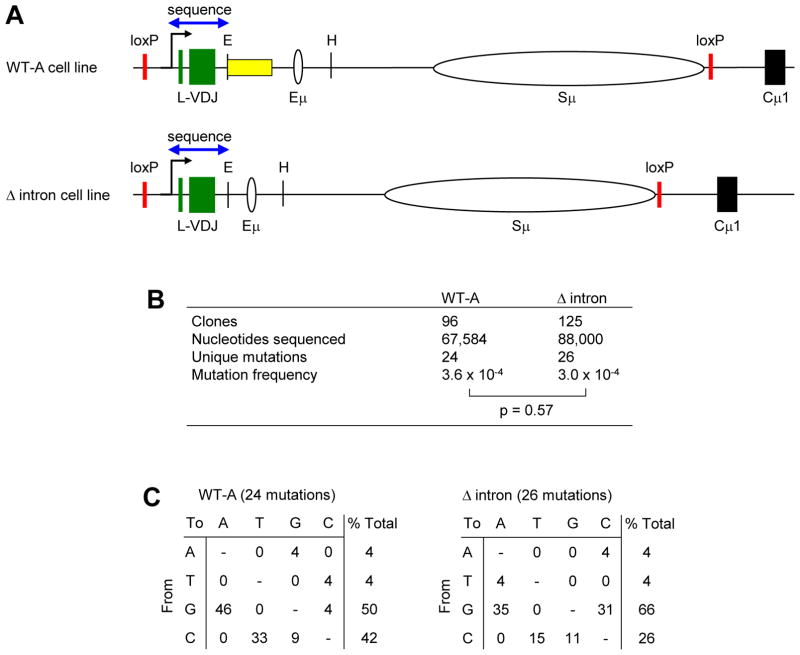
Fig. 5.
Mutation analysis in WT-A and Δ intron cells. A) Area sequenced for mutations, including exons and flanking DNA. Blue arrow represents 700 bp. B) Average mutation frequency from 2 and 4 independent clones for WT-A and Δ intron cell lines, respectively. P value by Fisher’s exact test. C) Types of substitutions. Data are expressed as % of the number of mutations.

