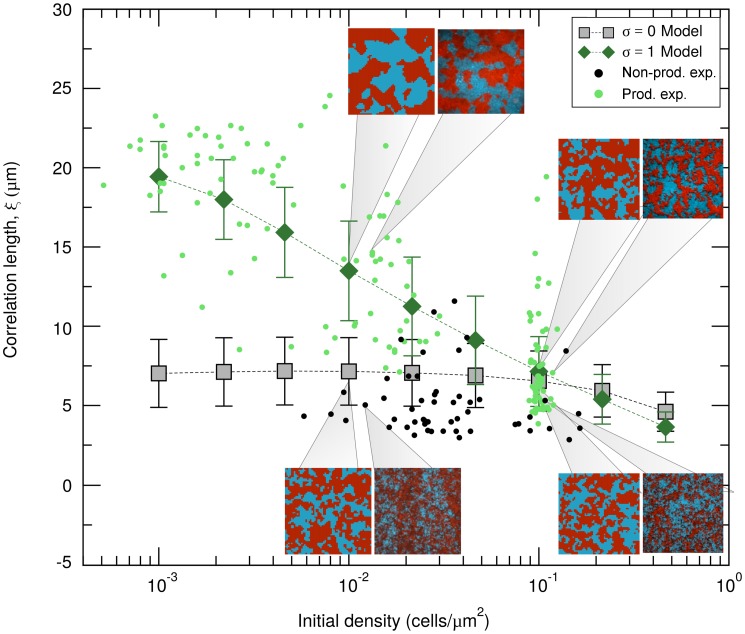
Fig 2. Model validation: Correlation length comparison.
Experimental correlation lengths measured in the matrix-producing (pale green dots) and non-producing (black dots) strain, and their model equivalent σ = 1 (dark-green diamonds), respectively σ = 0 (gray squares). Numerical results are shown for flow intensity f = 1, which gives the best agreement with the experiments, averages taken over 2x10⁶ independent realizations. Error bars represent the standard deviation. The insets show snapshots of colonization patterns obtained in the experiments (right) and the model (left) at initial colonization densities indicated by the gray pointers. Experimental surface occupation pictures used for this figure are available at: https://figshare.com/s/654db6149e509881588686.

