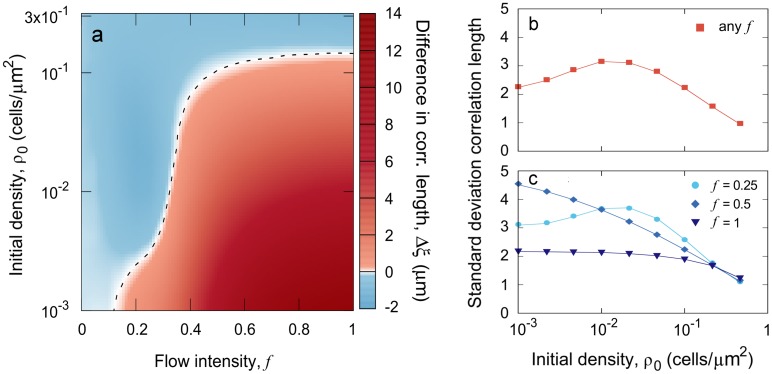
Fig 4. Model output: Mean cluster size and variability.
a) Difference in correlation length resulting from investing in cell adhesion for different flow intensities and initial colonization densities. The dashed line indicates the values of f and ρ0 at which this difference is equal to zero. Averages are taken over 5x10⁴ independent realizations. b, c) The standard deviation of the correlation length is a proxy for lineage segregation variability in highly-adhesive strains, (b; σ = 1) and weakly-adhesive cells (c; σ = 0). Averages are taken over 2x10⁶ independent realizations of the model.

