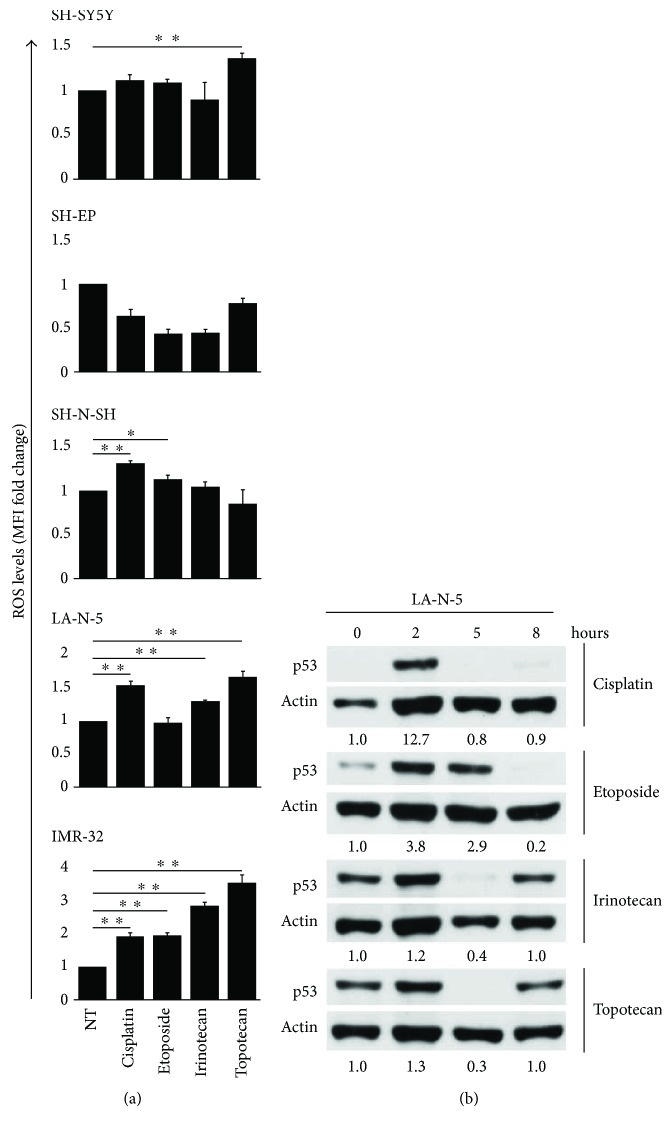
Figure 3.
ROS production and p53 stabilization in drug-treated NB cell lines. (a) NB cell lines were untreated (NT) or treated for 24 hours with cisplatin, etoposide, irinotecan, and topotecan, at the same concentrations described in Figure 1, and ROS production was measured by flow cytometry. Drug-induced ROS levels were expressed as MFI normalized to MFI of untreated cells used as control (MFI fold change). The mean ± SD of MFI fold changes obtained by 4 independent stainings of each drug-treated NB cell line are reported in histograms (two-tailed paired Student's t-test) (∗ p < 0.05, ∗∗ p < 0.01). (b) LA-N-5 was untreated (0) or treated with the same drugs at the same doses described above for 2, 5, and 8 hours, and levels of p53 were measured by immunoblot analysis. An anti-actin Ab was used for normalization. Densitometric analysis of p53 normalized to actin and relative to untreated cells (point 0) are reported below each immunoblot. A representative out of two independent experiments performed is shown.

