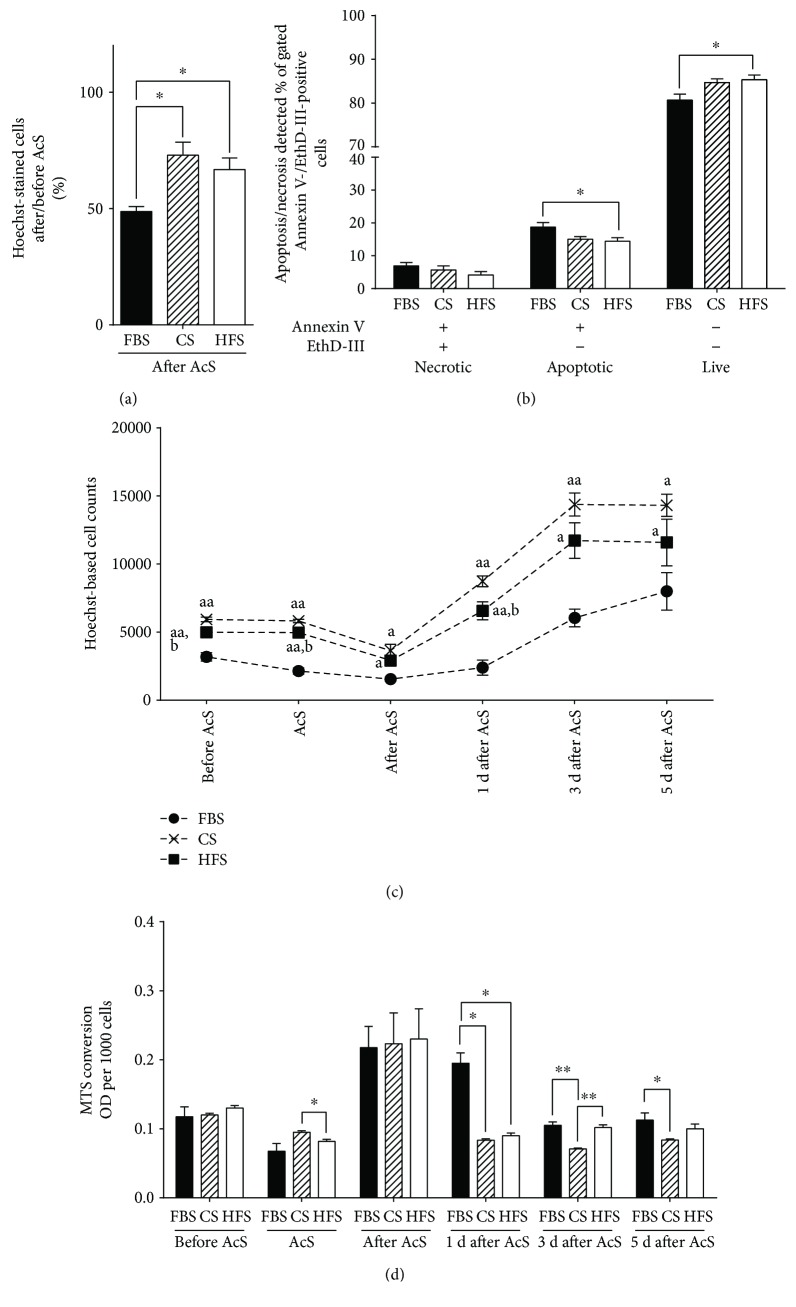
Figure 5.
Overview of survival and recovery of CB-MSCs after HFS and CS pretreatment and AcS. Survival rates (a) were calculated by normalizing to the cell numbers before AcS. Percentages of apoptotic, necrotic, and live cells (b) were quantified by flow cytometry. CB-MSC recovery was assessed by cell counting for five days (c). Metabolic activity was measured throughout days 0, 1, 3, and 5 after AcS (d). ∗p < 0.05 and ∗∗p < 0.01; ap < 0.05 and aap < 0.05 compared to the corresponding FBS groups and bp < 0.05 HFS groups compared to the corresponding CS groups.

