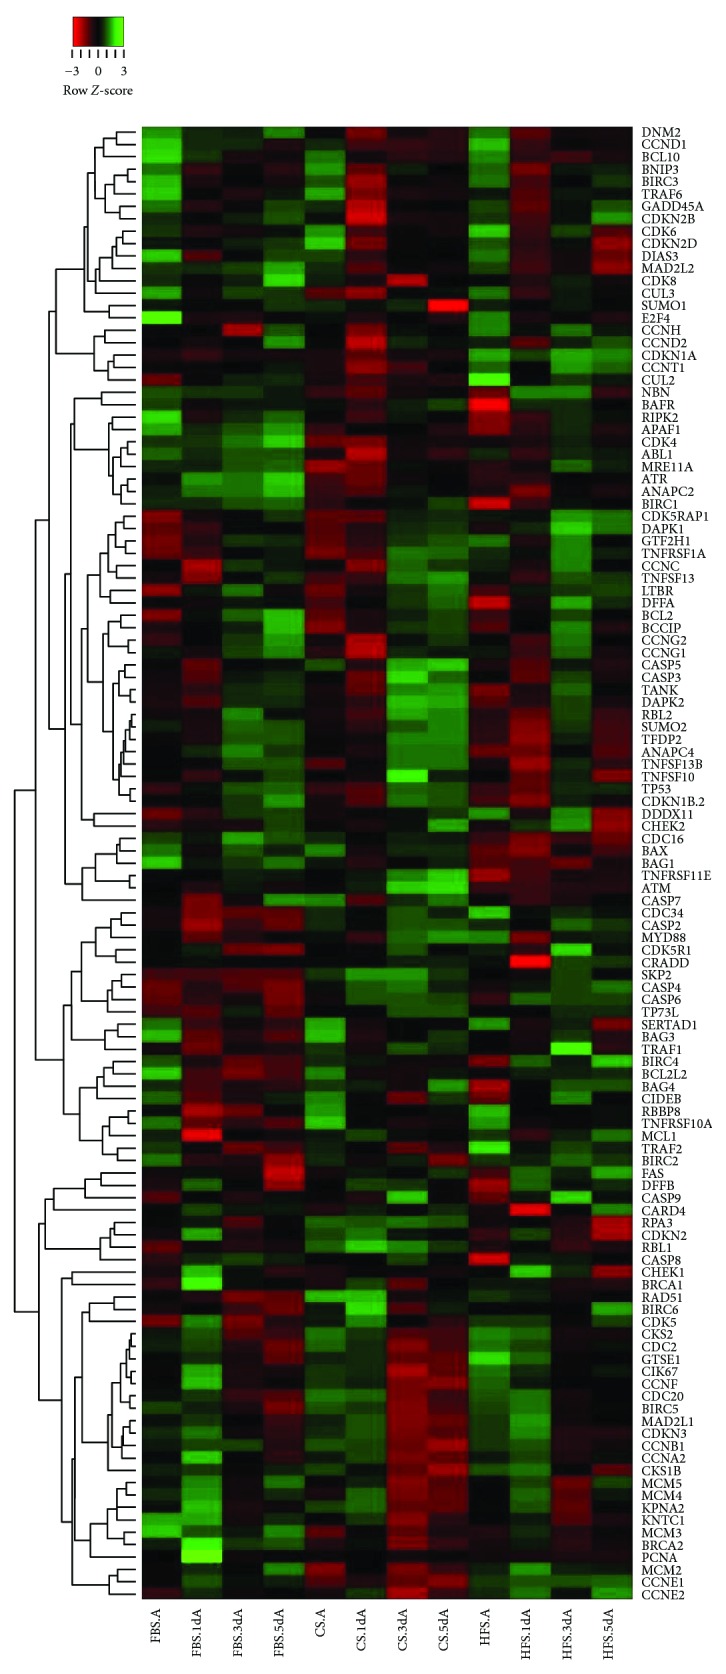
Figure 8.

Gene regulation of CB-MSCs under FBS, HFS, and CS cultivation through 5 days of recovery after AcS. The fold changes of mRNA expression relative to unexposed cells of 119 genes were included in this heatmap, which was constructed by using average linkage hierarchical clustering. Gene list was sorted, and distances among groups were calculated by Spearman rank correlation method. Relative regulation levels were represented by different colors, which reflected the row z-score shown in the red-green key.
