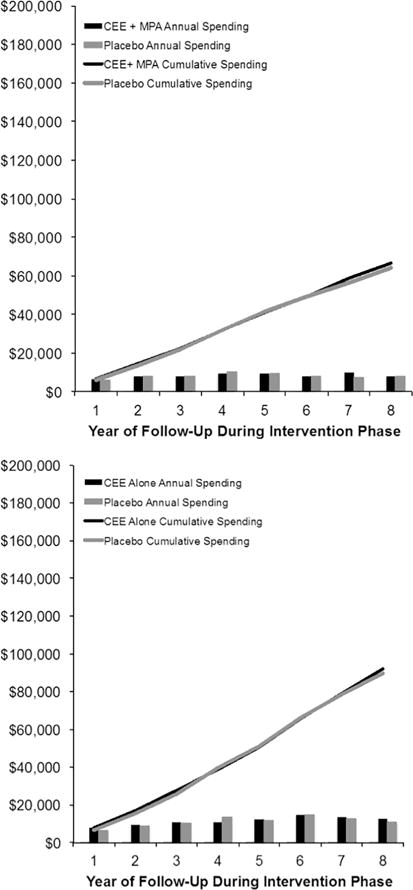
Figure 2.

Cumulative costs during the intevention phases of the CEE+MPA trial and CEE-alone trials. The vertical axis indicates cumulative spending in 2016 U.S. dollars, and the horizontal axis indicates the years of follow-up after randomization. The incremental costs in each follow-up year are indicated by the bar graphs at the bottom of the figure. The right panel provides data on the CEE+MPA trial, and the right panel provides data on the CEE-alone trial.
