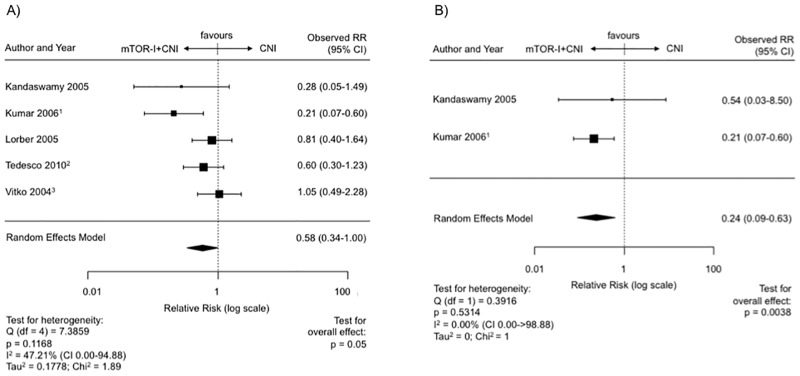
Fig 3. Malignancies on mTOR-I+CNI vs. CNI treatment post transplantation.
(A) Forest plot indicating the relative risk of the occurence of malignancies. 1 Last update by Kumar et al. in 2008. 2 Last update by Cibrik et al. 2013. 3 Last update by Vitko in 2005. (B) Forest plot indicating the relative risk of the occurence of malignancies excluding NMSC’s. 1 Latest update by Kumar et al. in 2008.

