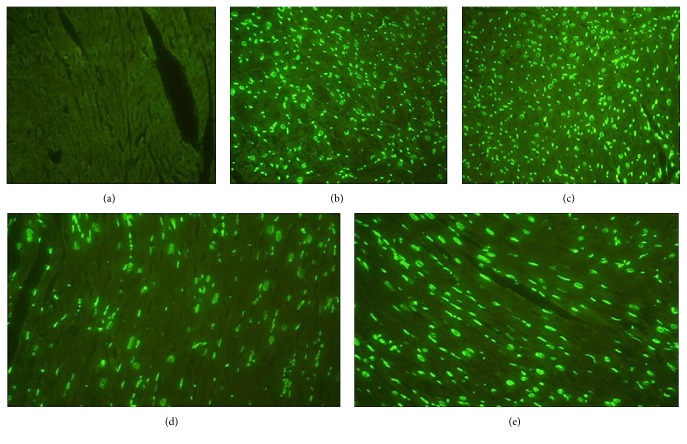
Figure 2.
5 views (a–e) of the heart tissue under the 400x microscope which were randomly taken from different groups. The apoptotic nuclei were labeled with green fluorescence and observed under fluorescence microscope. (a–e) separately represent the groups of SHAM (a), EA (b), SEA (c), EA + DR (d), and SEA + DR (e).

