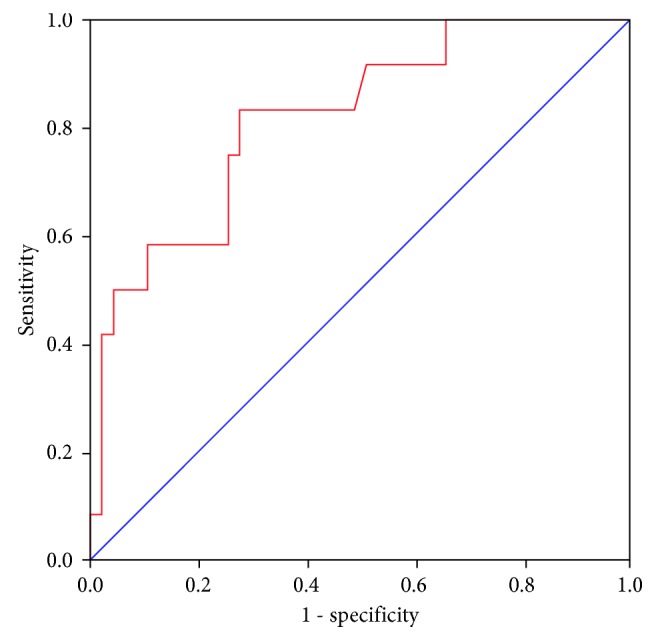
Figure 3.

Receiver-operating characteristic curve of predicted mortality by the binary logistic regression model. Blue line: 50% of area under the curve reference.

Receiver-operating characteristic curve of predicted mortality by the binary logistic regression model. Blue line: 50% of area under the curve reference.