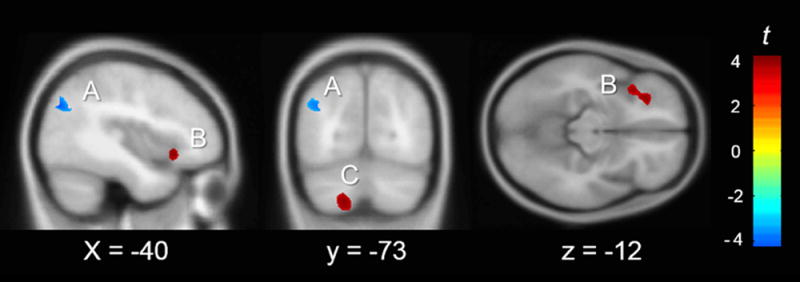
Fig. 2.

Significant clusters where slope of TCAP math predicting GMV is significantly different for grade-level split. Positive t-values indicate a greater slope for the higher grade levels (5th to 8th), negative t-values indicate a greater slope for the lower grade levels (3rd and 4 th). Overlaid on the MNI 152 template (n = 49). MNI slice coordinate listed. Cluster letters correspond to Table 6. (A) L Angular Gyrus, PGp (B) L IFG, orb (C) L Cerebellum, lobules VIIa & VIIIb.
