
Figure 2.
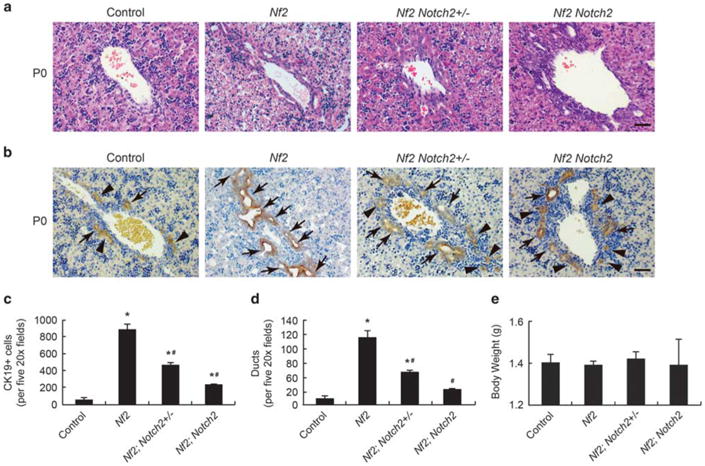
Suppression of Nf2 mutant intrahepatic bile duct development phenotypes by loss of Notch2 (P0). (a and b) H&E staining (a) and CK19 staining (b) of large portal vein area in P0 Control, Nf2, Nf2;Notch2+/− and Nf2;Notch2 livers. Arrows, primitive ducts. Arrowheads, nontubular ductal plate structures. Scale bars =50 μm. (c) Quantification of CK19-positive cholangiocytes for P0 livers. (d) Quantification of primitive ducts for P0 livers. (e) Comparison of body weights for P0 mice. Bars represent mean ±s.e.m. (n= 3 mice from each genotype). *P<0.05, compared with control, #P<0.05, compared with Nf2, one-way ANOVA and Fisher's LSD