
Figure 4.
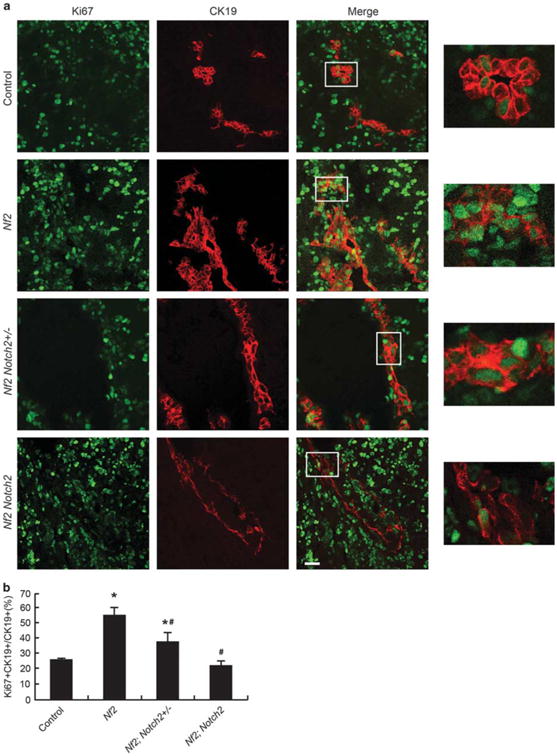
Loss of Notch2 suppresses cholangiocyte overproliferation induced by Nf2 deficiency during IHBD development. (a) Control, Nf2, Nf2;Notch2 +/− and Nf2;Notch2 livers from P0 animals were analyzed for Ki67 staining (green) and counterstained for the cholangiocyte marker CK19 (red). Scale bar= 25 μm. Representative areas are shown with higher magnification. (b) Quantification of Ki67-positive cholangiocytes. Bars represent mean±s.e.m. (n= 3 mice from each genotype). *P<0.05, compared with control, #P<0.05, compared with Nf2, one-way ANOVA and Fisher's LSD.