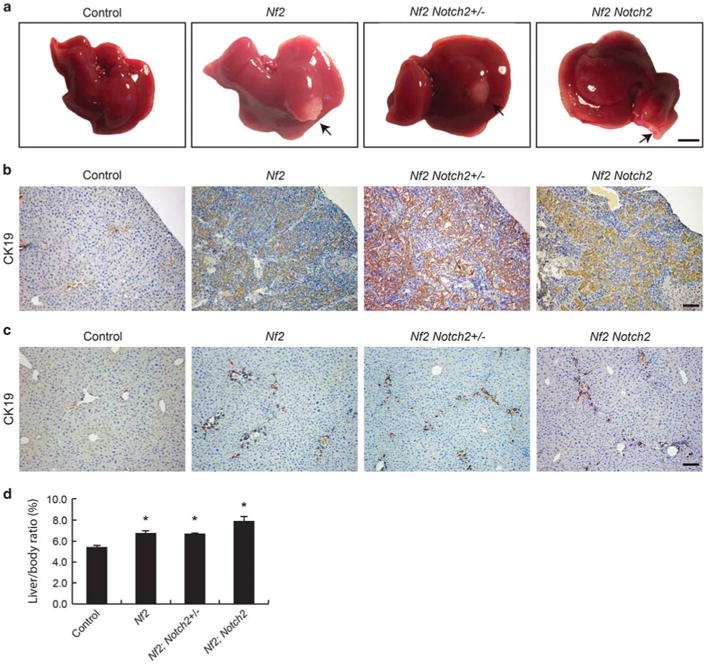
Figure 5.

Cholangiocyte proliferation continues in adult Nf2;Notch2+/− and Nf2;Notch2 mice. (a) Gross liver images from 8-week-old animals. Note the formation of biliary hamartoma in Nf2, Nf2;Notch2+/− and Nf2;Notch2 livers (indicated by arrows and confirmed by CK19 staining in b). Scale bar= 0.5 cm. (b) CK19 staining of the biliary hamartoma shown in a, Scale bar= 100 μm. (c) CK19 staining of deep parenchymal area of control, Nf2, Nf2; Notch2+/− and Nf2;Notch2 livers from 8-week-old animals. Scale bar = 100 μm. (d) Quantification of liver-to-body ratio of 8-week-old animals. Bars represent mean± s.e.m. (n = 3 mice from each genotype). *P<0.05, compared with wild-type control, one-way ANOVA and Fisher's LSD.
