
Fig. 1.
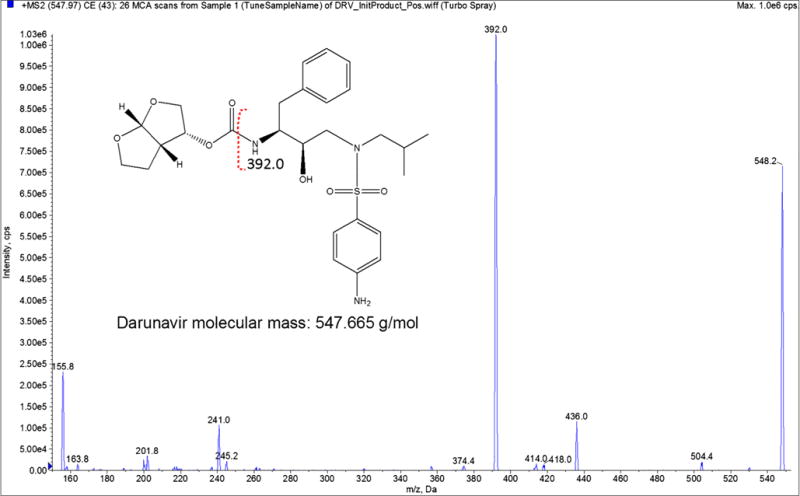
Electron ionization MS/MS spectrum of Darunavir (DRV). The y-axis shows the intensity (CPS, count per second); the x-axis shows the mass to charge ratio (m/z, Da). The EVG structure was made using ChemDraw. Red dotted annotation on the structure shows the fragmentation spectra for DRV.