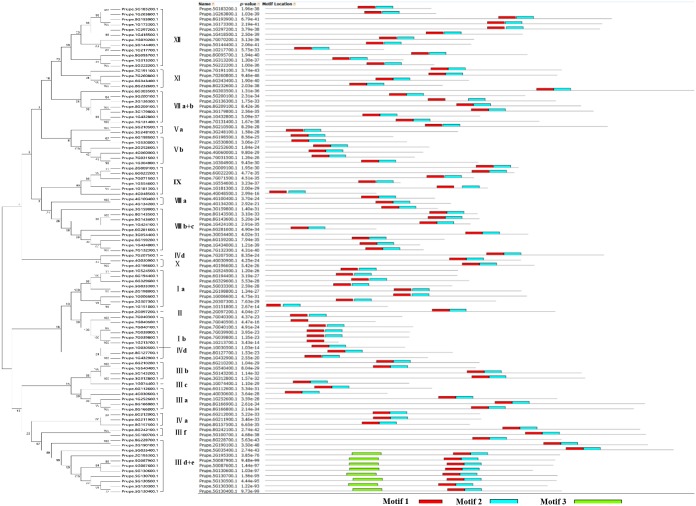
Fig 2. Motif distribution of peach bHLH superfamily proteins.
The motifs of the bHLH superfamily proteins were analyzed using the MEME web server. The red, blue, and green blocks represent motifs 1, 2 and 3, respectively. The length of the gray line indicates the length of a sequence relative to all the other sequences. The position of each block indicates the location of a motif with a matching sequence. The phylogenetic tree on the right was constructed using only the sequences of bHLH proteins from peach.

