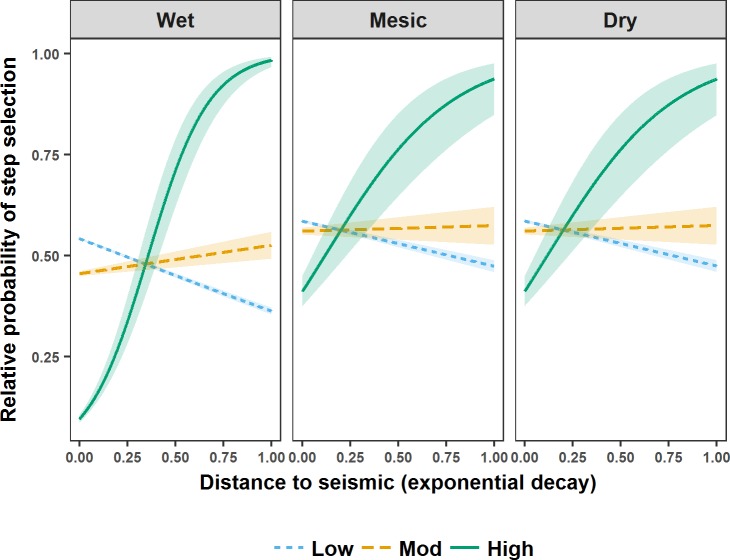
Fig 5. Relative probability of step selection by male grizzly bears in west-central Alberta during spring.
Relative probability of step selection by male grizzly bears in west-central Alberta between 2005 and 2009 during spring in relation to distance to seismic lines (represented as an exponential decay (1-exp-0.002* Distance (m))), seismic line vegetation height (visualised using the mean of the lower (Low), middle (Mod), and upper (High) quantiles), and seismic lines wetness (represented as an exponential decay (1-exp-1.55*WAM(m)) and visualised using the mean of the lower (Wet), middle (Mesic), and upper (Dry) quantiles. Shaded areas are 95% confidence intervals around relative predicted probabilities of step selection.

