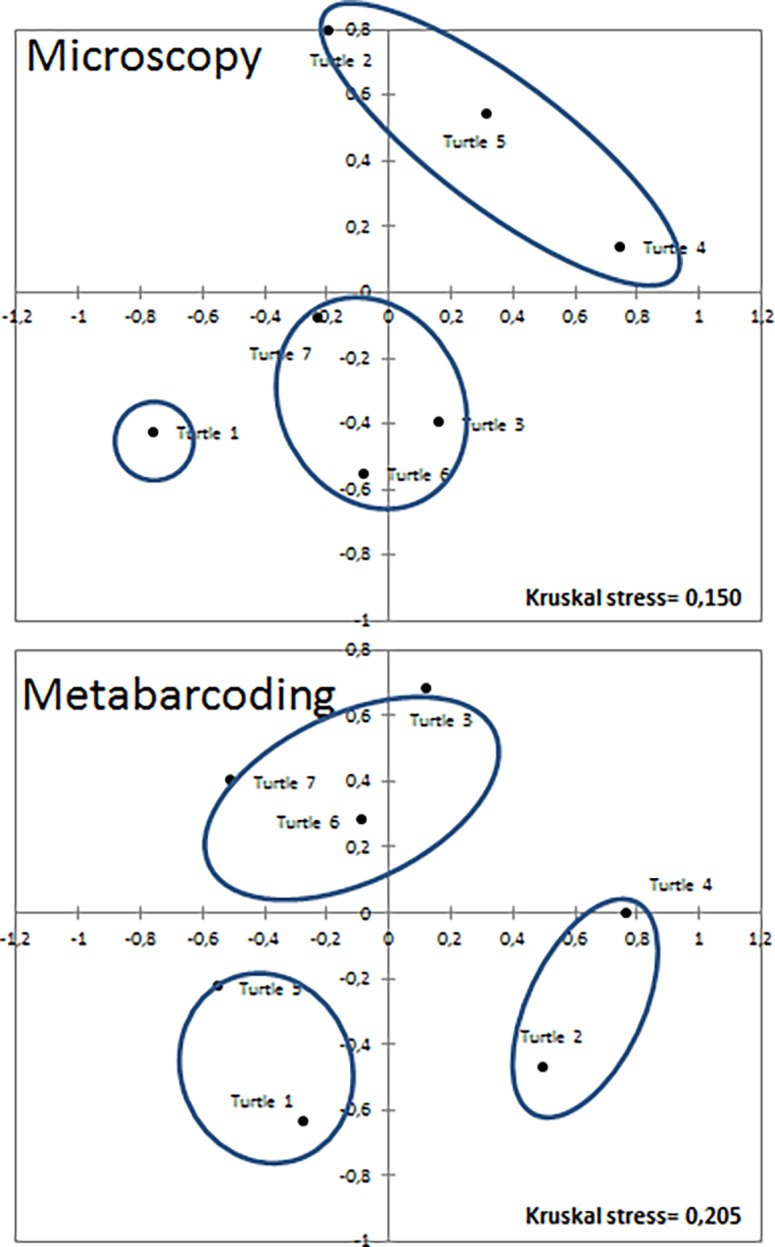
Fig 4. NMDS ordination plots and cluster representations.

K-means and NMDSs were calculated based on the Bray-Curtis distances of the species lists and the OTU lists (each expressed in percentages) obtained using microscopy and metabarcoding, respectively.
