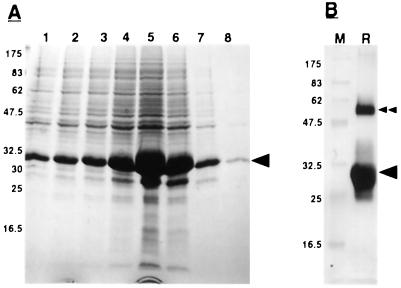
Figure 1.
Purification of recombinant PsCYP15A. A, SDS-PAGE of successive fractions from a nickel affinity column after the addition of elution buffer, pH 4.0; numbers to the side indicate molecular mass of marker proteins (kD); arrowhead indicates recombinant protein band that is the most intense in fraction 5. B, Western blot of electro-eluted recombinant PsCYP15A from fraction 5, using T7 Tag monoclonal antibody. M, Marker lane; R, recombinant protein lane; arrowhead, recombinant protein band; double arrowhead, higher Mr recombinant band, presumably resulting from dimerization of recombinant PsCYP15A monomer.

