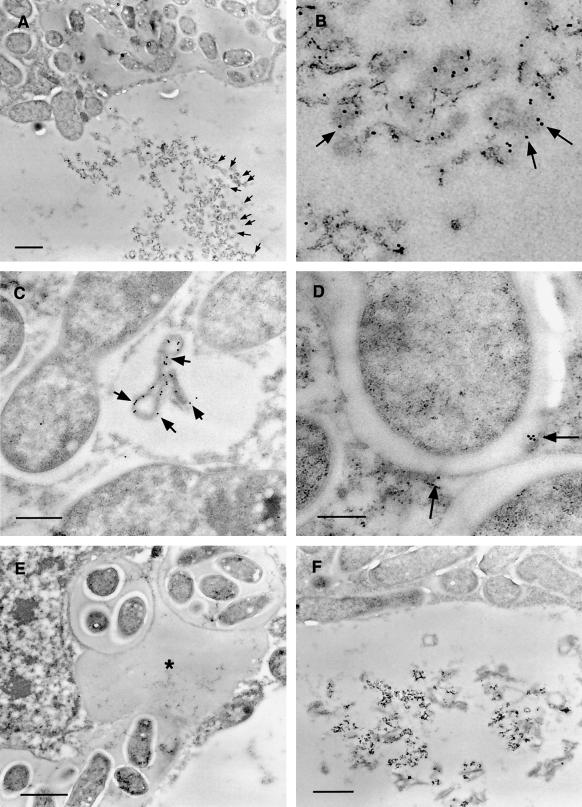
Figure 5.
Immunogold-labeled nodule sections treated with R79 antiserum and visualized by transmission electron microscopy. A, Infected cell showing electron-dense aggregate within the vacuole heavily decorated with 15-nm immunogold particles (black dots indicated by arrows). Bar = 1 μm. B, Enlargement of vacuolar aggregate shown in A, with arrows indicating immunogold particles. C, R79-labeled infected cell showing cytoplasmic vesicle containing electron-dense material decorated with 15-nm immunogold. Bar = 500 nm. D, R79-labeled infected cell showing 15-nm immunogold particles associated with the perisymbiont area (arrows). Bar = 200 nm. E, R79-labeled infected cell showing cross-section through an infection thread and infection droplet. No immunogold label is seen associated with the infection thread matrix (asterisk). Bar = 1 μm. F, Infected cell challenged with preimmune serum, showing no immunogold labeling of perisymbiont spaces or aggregated vacuolar material. Bar = 1 μm.

