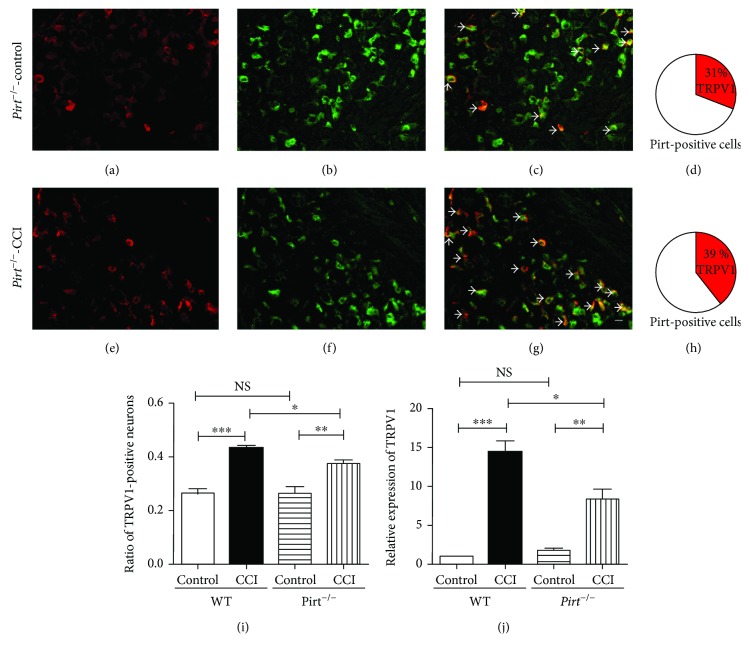
Figure 4.
Expression of TRPV1 increased less in Pirt knockout mice in CCI models. Representative images show TRPV1-positive cells (a), Pirt-positive cells (b), or a merge of TRPV1-positive and Pirt-positive neurons (c) in the control group. 31% TRPV1-positive DRG neurons are Pirt positive (d). In CCI models, representative images show TRPV1-positive cells (e), Pirt-positive cells (f), or a merge of TRPV1-positive and Pirt-positive neurons (g) in the control group. 39% TRPV1-positive DRG neurons are Pirt positive (h). The arrows indicate double-labelling cells. Scale bar: 20 μm. The results of histochemistry staining (i) show TRPV1-positive neurons in WT and Pirt knockout mice in CCI models. (j) Real-time PCR results indicate the expression of TRPV1 in WT and Pirt knockout mice in CCI models. ∗P < 0.05, ∗∗P < 0.01, and ∗∗∗P < 0.001.

