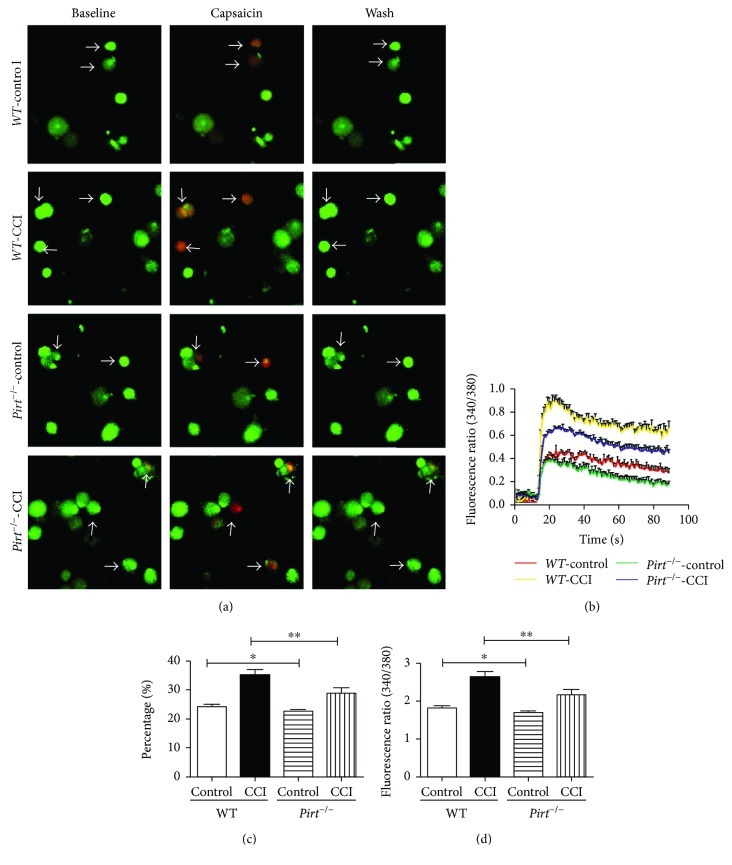
Figure 5.
Pirt knockout attenuated capsaicin-induced response in CCI-treated sensory neurons. (a) Fluorescence image of intracellular calcium flux induced by capsaicin. Arrows indicate the response to capsaicin in WT and Pirt−/− DRG neurons in CCI models and the control group. Scale bar: 20 μm. (b) Representative fura-2 ratio metric responses in cultured DRG neurons. The curves indicate the response to capsaicin in Pirt−/− mice and WT mice. (c) The percentages of DRG neurons from WT and Pirt−/− mice that responded to capsaicin (% of total neurons, n = 3/group). (d) Fluorescence intensities of capsaicin (1 μM)-induced calcium influx. ∗P < 0.05 and ∗∗P < 0.01.

