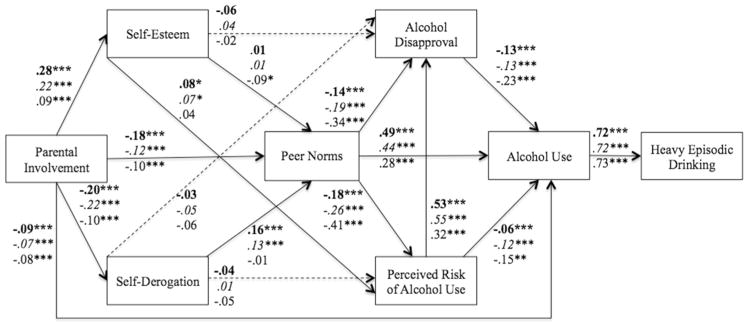
Fig. 2.
Path analytical model for 8th, 10th, and 12th grade samples. Solid paths are statistically significant for all respondents in at least one grade. Bold numbers denote 8th grade data, italicized numbers signify 10th grade data, and regular type font indicate 12th grade data. All analyses include gender and race/ethnicity as covariates. ***p < .001, **p < .01, *p < .05

