
Figure 5. SIRT3 Overexpression Suppresses mTORC1 and Breast Cancer Growth In Vivo.
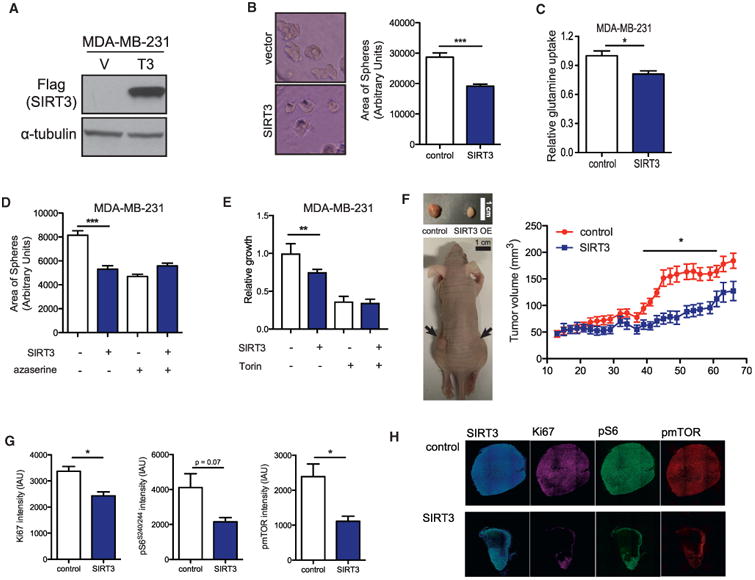
(A) Immunoblots of Flag-SIRT3 overexpression in MDA-MD-231 cells.
(B) Representative images and quantification of the area of spheres formed by control or SIRT3-overexpressing MDA-MB-231 cells. Data are represented as mean ± SEM.
(C) Glutamine uptake in control or SIRT3-overexpressing MDA-MB-231 cells. Data are represented as mean ± SEM.
(D) Area of spheres formed by control or SIRT3-overexpressing MDA-MB-231 cells treated with or without azaserine in 3D culture. Data are represented as mean ± SEM.
(E) Relative cell number after Torin treatment of control or SIRT3-overexpressing MDA-MB-231 cells in 3D cultures. Data are represented as mean ± SD.
(F) Representative image of nude mice injected with control or SIRT3-overexpressing MDA-MB-231 cells. Growth curve of xenograft tumors: 2 × 10⁶ control or SIRT3-overexpressing MDA-MB-231 cells were injected into the flanks of nude mice (n = 10). Data are represented as mean ± SEM.
(G) Quantification of Ki67, phospho-S6, and phospho-mTOR immunofluorescence in control compared with SIRT3-overexpressing xenograft tumors.
(H) Representative images of tumors analyzed in (G).
Data in this figure are represented as mean ± SEM.
The final images for this figure were stitched from multiple images (10× magnification, with the size of each image 1.6mm*1.2mm) through the use of ImageJ. The lines show the boundaries of each individual frame.