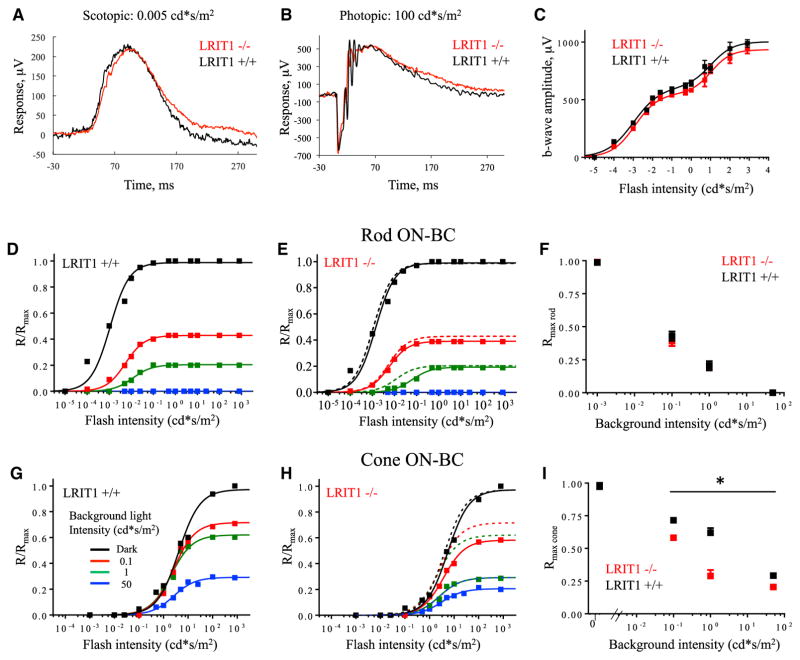
Figure 5. Analysis of LRIT1 Knockout by Electroretinography.
(A) Representative electroretinography (ERG) waveform recorded from dark-adapted mice in response to scotopic flash of light.
(B) Representative ERG waveform recorded from dark-adapted mice in response to photopic flash of light.
(C) Light-dependence profile of b-wave amplitudes. 4–6 mice were used for each genotype.
(D) Rod-driven component of the b-wave across light intensities recorded in wild-type mice under dark-adapted conditions and various levels of background light. The first phase of the response at scotopic light intensities in (C) is shown.
(E) Rod-driven component of the b-wave across light intensities recorded in Lrit1 knockout mice under dark-adapted conditions and various levels of background light. Dashed lines represent superimposed fits from WT in (D).
(F) Normalized changes in maximal amplitude of the rod-driven b-wave as a function of background light intensity recorded in both genotypes.
(G) Cone-driven component of the b-wave across light intensities recorded in wild-type mice under dark-adapted conditions and various levels of background light. The second phase of the response at photopic light intensities in (C) is shown.
(H) Cone-driven component of the b-wave across light intensities recorded in Lrit1 knockout mice under dark-adapted conditions and various levels of background light. Dashed lines represent superimposed fits from wild-type mice in (G).
(I) Normalized changes in maximal amplitude of the cone-driven b-wave as a function of background light intensity recorded in both genotypes.

