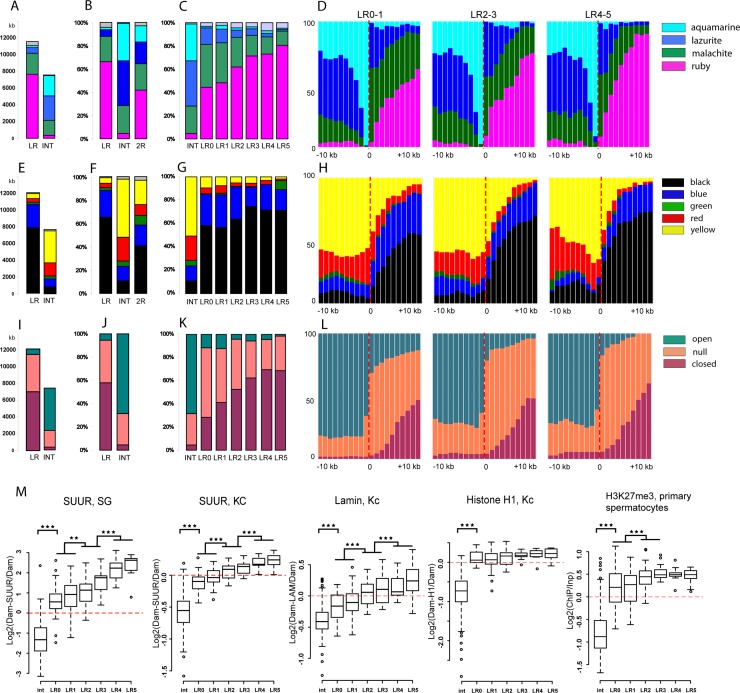
Fig 7. The rb-bands are significantly enriched with repressive chromatin types.
(A) Distribution of four chromatin types [4] in all 2R rb-bands and INTs. The data are expressed in kb. (B) Distribution of four chromatin types [4] in all 2R rb-bands and INTs. The data are expressed in percentage points. (C) Distribution of four chromatin types [4] in rb-bands classified into replication timing groups LR0–LR5 and into INTs. (D) An averaged distribution of four chromatin types [4] at locations close to the boundaries of LR0–1, LR2–3, and LR4–5 rb-bands. (E–G) A distribution of five chromatin types in Kc cells [21] in rb-bands and INTs. The data are expressed in kb (E) and in percentage points (F, G). An averaged distribution of five chromatin types in Kc cells [21] at locations close to the boundaries of LR0–1, LR2–3, and LR4–5 rb-bands. (I–K) Distribution of differently compacted chromatin types in S2 cells [58] in rb-bands and INTs. The data are expressed in kb (I) and in percentage points (J, K). (L) An averaged distribution of differently compacted chromatin types in S2 cells [58] at locations close to the boundaries of LR0–1, LR2–3, and LR4–5 rb-bands. (D, H, L) The band boundary is at position zero. To the right: within-band regions; to the left: outside regions. The increment is 1 kb. (M) Boxplots of the distribution of mean scores for repressed-chromatin markers in LR0–LR5 rb-bands and INTs. Markers: SUUR in salivary glands (according to [59]), SUUR in Kc cells [21], LAMIN in Kc cells [60], histone H1 in Kc cells [21], and H3K27Me3 in primary spermatocytes [31]. All rb-bands are significantly different from INTs (***p < E-14, **p < E-3; Mann–Whitney U test).

