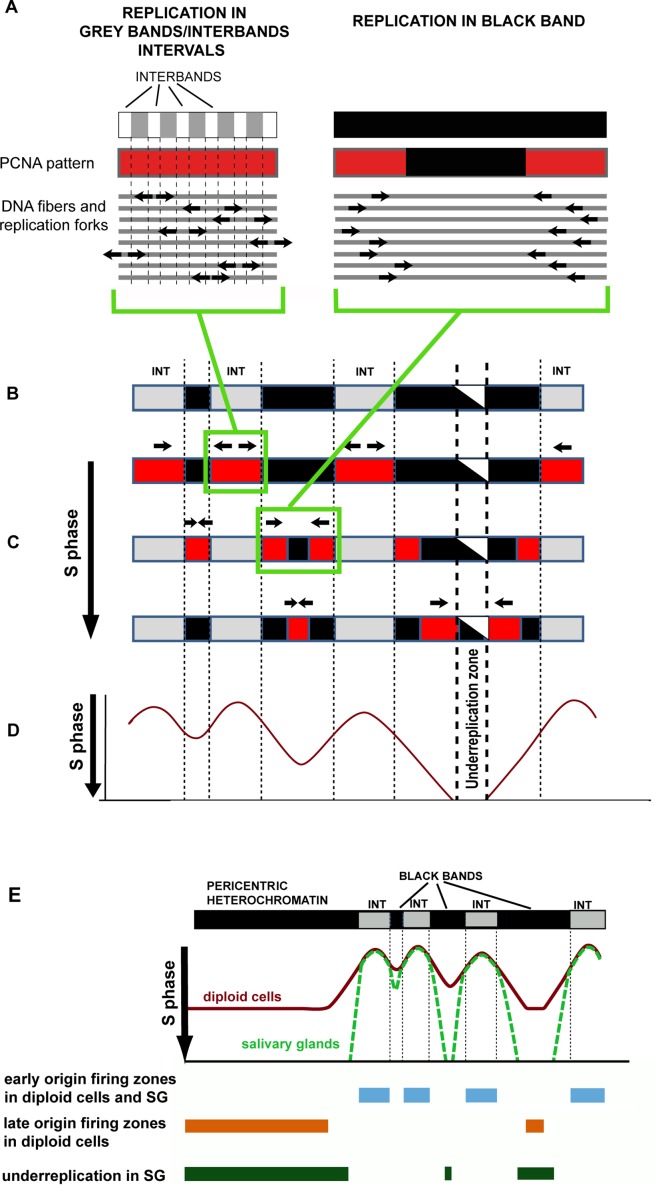
Fig 8. The logic of changing patterns in polytene chromosomes.
Links between these patterns and events at the DNA sequence level. (A) A schematic of replication fork locations and the corresponding PCNA patterns in the zone of alternating grey bands and interbands and in an rb-band (black in the figure). (B) A schematic of a polytene chromosome region with three rb-bands (black in the figure) of different lengths. Intervals between rb-bands appear as grey bands and interbands. (C) Consecutive changes in PCNA binding patterns (red in the figure) during the S phase. Top to bottom: continuous labeling substage; the substage at which the label is seen in all rb-bands; the late S phase, when only the thickest bands get labeled. The central part of the thickest band contains a region that never undergoes replication. (D) Replication fork locations depending on time (time passes in the downward direction). Replication fork locations were inferred under the assumption that replication is initiated randomly at each INT point once per INT in each replication cycle, with little asynchrony. Differences in replication rates between different genomic regions were ignored. The portion of the profile corresponding to the under-replication zone is beyond the S phase. If the differences in replication rates between rb-bands were to be considered, the local minima would be deeper. (E) A model reflecting similarities and differences in replication timing between diploid cell chromosomes and salivary gland polytene chromosomes. Averaged replication profiles are identical in early replication initiation zones. A portion of the genome in salivary gland polytene chromosomes is slower to replicate because of slow replication in “black” bands and the absence of late origin firing; this portion stays under-replicated.

