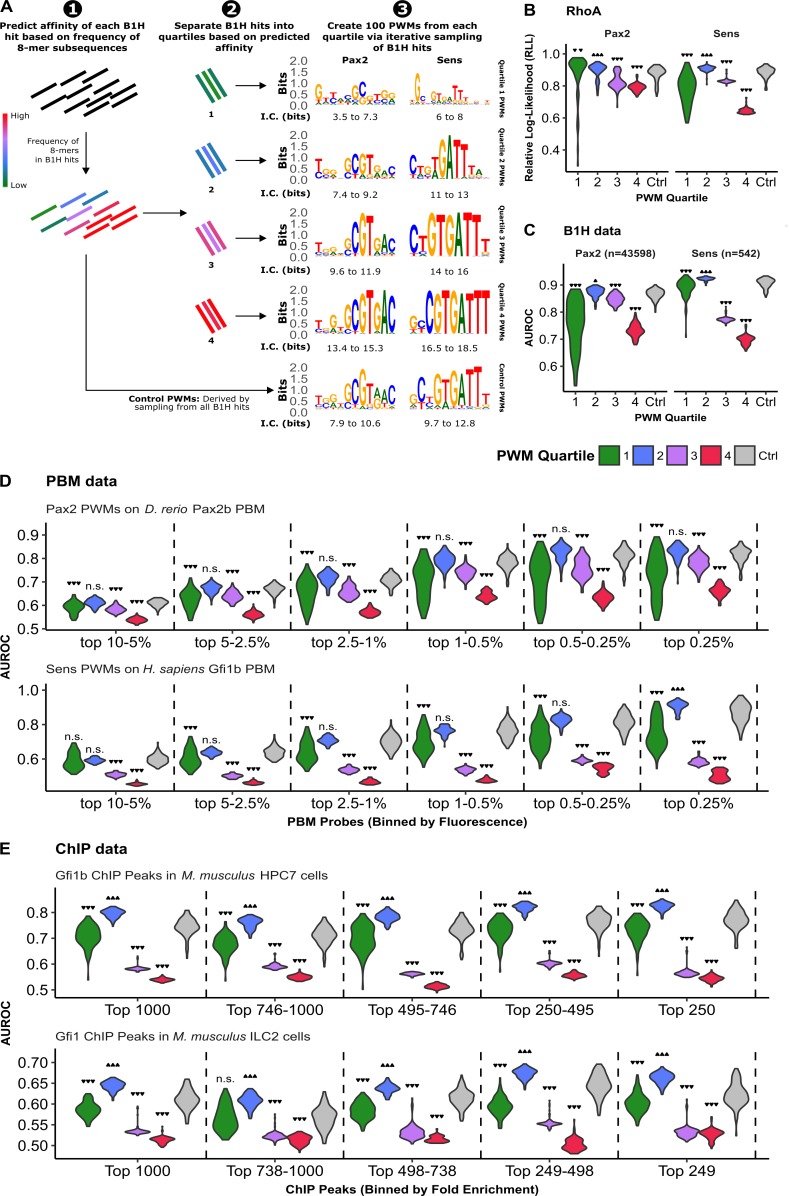
Fig 7. High information content PWMs are less accurate at identifying TFBSs obtained from both in vitro and in vivo binding events.
(A) Schematic describing how PWMs were created by sub-sampling Sens and Pax2 B1H hits. Each B1H hit was placed into quartiles based on 8-mer sequence frequency within the pool of B1H hits. 100 PWMs were generated by iteratively sampling 50 B1H hits from each quartile. 100 PWMs were also generated by sampling 50 B1H hits from the entire pool (Control PWMs). The range of total information content (I.C.) for PWMs in each quartile are indicated below the motifs. (B) Relative log-likelihood (RLL) score of each PWM for the RhoA sequence. (C) AUROC of each PWM for discriminating low-stringency B1H hits from shuffled sequences. (D) AUROC of each PWM for discriminating bound PBM probes (binned by fluorescence, as indicated on x-axis) from non-specifically bound probes (matched number of control probes randomly selected from the 50% of probes with the lowest fluorescence). (E) AUROC of each Sens PWM for discriminating M. musculus Gfi1 and Gfi1b ChIP-seq peaks from random, non-repetitive genomic sequences. Gfi1b ChIP-seq was conducted using multipotent Hematopoietic Progenitor cells (HPC-7) and Gfi1 ChIP was conducted using innate Type-2 Lymphocytes (ILC2) [32, 33]. Analysis was limited to the 1000 peaks with greatest fold enrichment per ChIP dataset, and ChIP peaks were binned by fold enrichment as indicated on x-axis. For panels C-E, AUROCs represent the median using 10 different sets of negative sequences. All violin plots are scaled to have the same width. Statistical analysis was performed using Kurskal-Wallis test followed by a post-hoc pairwise Mann-Whitney U test. P-values were Bonferroni-adjusted due to multiple comparisons arising from groups of PWMs (all panels) and binning of sequences (panels D and E) (n.s. p ≥ 0.05; * p < 0.05; ** p < 0.01, *** p < 0.001).

