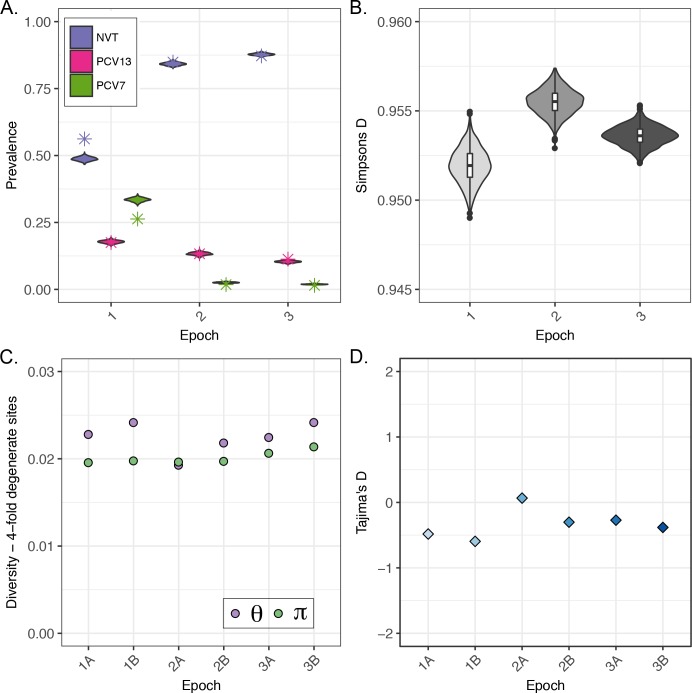
Fig 2. Pneumococcal population dynamics pre- and post-vaccine, 1998–2012.
The study periods were subdivided into three epochs and six sub-epochs: Pre-PCV7 [Epoch 1: A (n = 105), B (n = 169)], Post-PCV7 [Epoch 2: A (n = 79), B (n = 319)], and PCV13-Intermediate [Epoch 3: A (n = 119), B (n = 146)]. A.) The proportions of vaccine types (VT) for each epoch from three parent studies (violin) and current study subsample (asterisk). Parent study VT proportions are estimated from serotypes of 3,868 carriage events from previous N/WMA studies [1,6,30]. PCV7 VT include serotypes 4, 6B, 9V, 14, 18C, 19F and 23F. PCV13 vaccine types (minus PCV7 types) include only serotypes 1, 3, 5, 6A, 7F, 19A. Violin plots represent the realization of 1000 bootstrap replicates subsampling with replacement from each epoch. Asterisks represent the point estimates for VT proportions in the current study. B.) Simpson’s Diversity Index of serotype diversity across study periods estimated from three parent studies (n = 3,868). This measure summarizes the number and abundance of each serotype. C.) Population genetic measures of diversity, Watterson estimator (Θw) and π (average number of pairwise differences), estimated from 4-fold (synonymous) degenerate sites of taxa in sub-epochs of the current study. D.) Population genetic statistic Tajima’s D estimated from the core genomes of taxa in sub-epochs of the current study. Negative values of Tajima’s D indicate many sites with a rare minor alleles.

