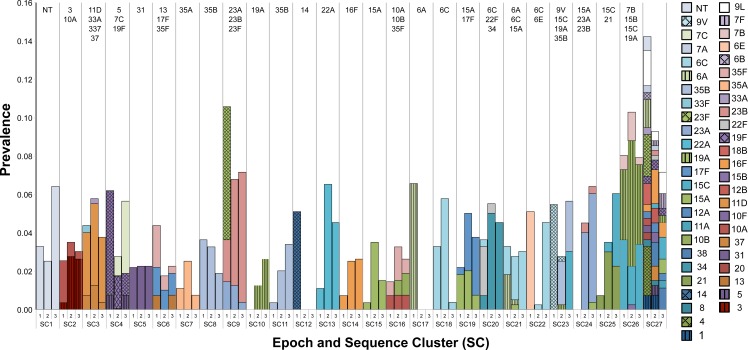
Fig 3. Population structure of pneumococcal carriage isolates among N/WMA.
Populations are divided into sequence clusters (SC) based on genomic data and further subdivided into three epochs based on collection date. The bars represent the proportion of population comprising each SC during an epoch and are stratified by serotype composition. Solid bars represent non-vaccine serotypes; checkered hatched pattern PCV7 vaccine types; and vertical line pattern PCV13 vaccine types (those not included in PCV7). Serotypes comprising each SC are also labeled above each column. All SCs except SC4 and SC27 are monophyletic. SC4 is has three distinct sub-clades and SC27 include polyphyletic lineages present at minor frequencies in the population.

