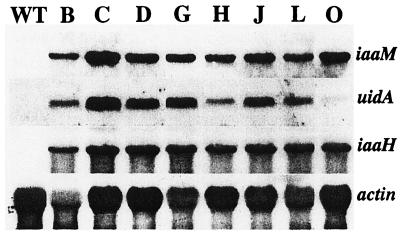
Figure 3.
RNA-blot analysis of iaaM, uidA, iaaH, and actin genes in wild-type (WT) and transgenic hybrid aspen lines B through O. Total RNA was obtained from the cambial region tissues of the stem. Approximately 15 μg of total RNA was loaded on each lane. The expression level of the actin gene was used to estimate differences in the loading of the samples.

