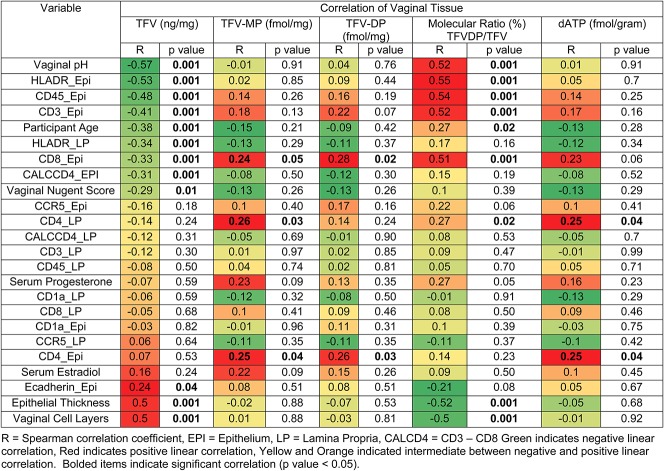
FIGURE 1.
Heat map of simple linear correlations between vaginal tissue TFV and TFV-DP concentrations and the molecular ratio of TFV-DP to TFV with mucosal end points of all premenopausal and postmenopausal participants at all TFV gel use visits. EPI, epithelium; LP, lamina propria; R, Spearman correlation coefficient; CALCD4, CD3–CD8. Green indicates negative linear correlation, red indicates positive linear correlation, and yellow and orange indicate intermediates between negative and positive linear correlation. Bolded items indicate significant correlation (P value < 0.05).

