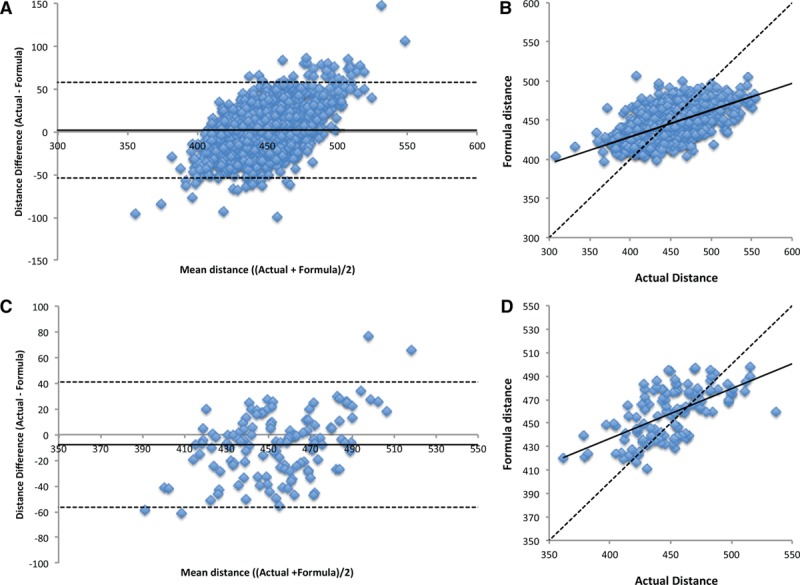
Figure 2.

Bland–Altman and scatter plots of the predicted path length generated using the formula versus the true distance measured on whole body angiography in the TASCFORCE (A and B) and SUMMIT (C and D) cohorts. SUMMIT indicates Surrogate Markers of Micro- and Macrovascular Hard End-Points for Innovative Diabetes Tools; and TASCFORCE, Tayside Screening for Cardiovascular Events.
