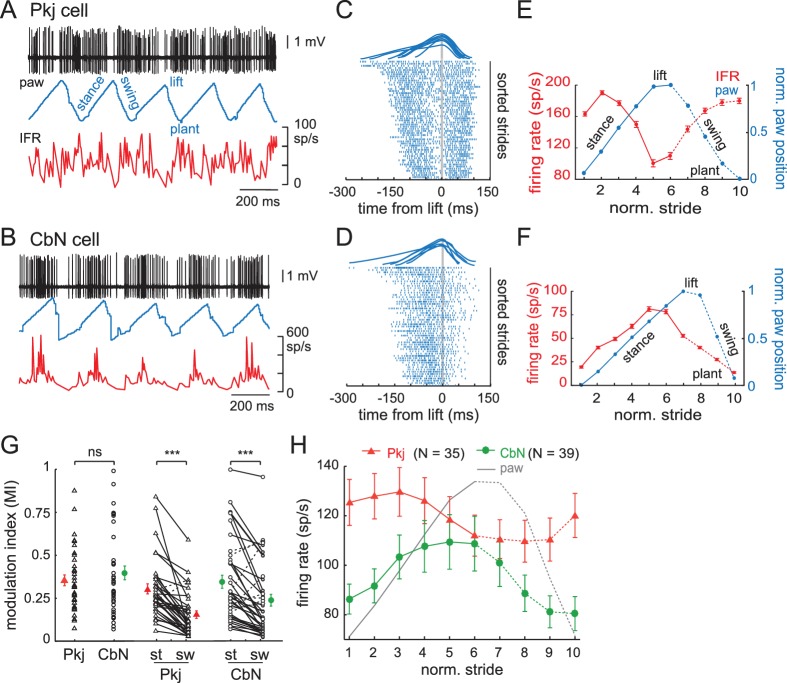
Figure 3. Modulation of firing rates relative to the phase of strides.
(A) Sample records from a running mouse of Purkinje cell spikes, paw position, and instantaneous firing rate, illustrating stance, swing, lift, plant, component phases of a stride. (B) As in (A), for a CbN cell. (C) Top, sample strides aligned to lift. Raster plots of firing by the Purkinje cell in (A) during strides sorted by duration and aligned to the lift phase. Every third stride of 171 strides is plotted. (D) As in (C), for the CbN cell in (B). Rasters during every third stride of 159 strides. (E, F) Red, binned instantaneous firing rates averaged across all lift-aligned strides vs. normalized stride bin. Blue, paw position averaged across all normalized strides. Data from the Purkinje cell in (A, C) and the CbN cell in (B, D). (G) Modulation indices (MI) for all cells calculated from the mean IFR curves as in (E, F). Open symbols, individual cells, filled symbols, means; st, stance phase; sw, swing phase. (H) Population average of all IFR tuning curves across all Purkinje and CbN cells, superimposed on paw position. Solid line, stance; dotted line, swing. On all panels, all figures, ns, non-significant, *p<0.05, **p<0.01, ***p<0.001.

