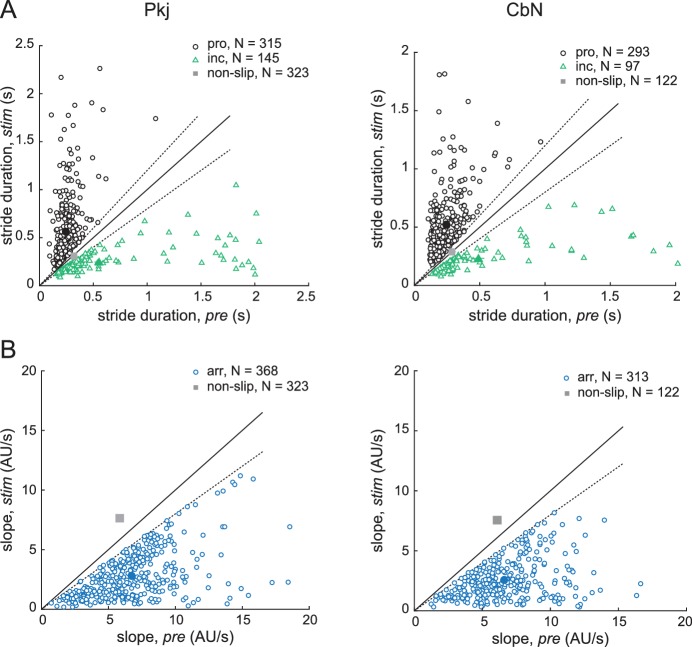
(A) Stride duration during vs. before light stimulation for all automatically detected slip trials obtained during recordings from Purkinje cells (left) and CbN cells (right). Black, prolonged strides, green, incomplete strides, open symbols, values from each trial, closed symbols, mean values. Grey symbols, mean ± SEM (within the symbol) values for all non-slip trials. Solid lines, unity; dotted lines, threshold for slip classification, that is, 20% deviation from unity. (B) Stance or swing slope during vs. before light stimulation for all automatically detected arrested stride slip trials obtained during recordings from Purkinje cells (left) and CbN cells (right). Whichever phase (stance or swing) was more greatly altered is plotted. Grey symbols, mean ± SEM (within the symbol) values for all non-slip trials. Solid lines, unity; dotted lines, threshold, that is, 20% deviation from unity.


