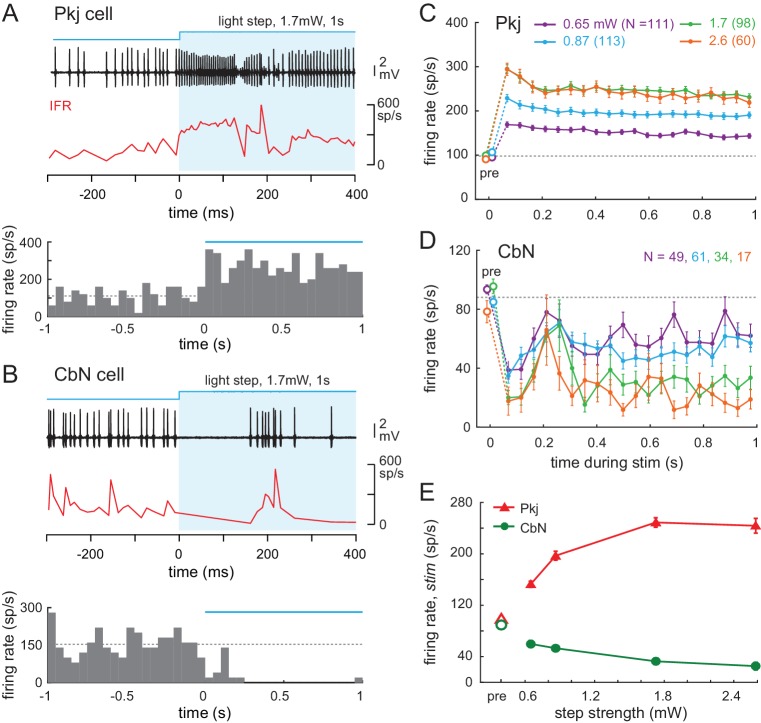
Figure 6. Effects of light steps on Purkinje and CbN cell firing.
(A, B) Top, Sample traces from a Purkinje (A) and CbN cell (B) in response to the first 400 ms of a light step (blue shading). Instantaneous firing rate (red, IFR). Bottom, PSTH of the examples in (A, B) for the full 1 s of stimulation. Light onset, 0 ms. Bin width, 50 ms; blue line, light duration, dotted line, mean pre-stimulus firing rate for that trial (1 s). (C, D Mean PSTHs across all trials for all step intensities for all 35 Purkinje (C) and all 39 CbN cells (D) Bin width, 50 ms; pre, pre-stimulus rates; dotted line, mean pre-stimulus rates in all conditions. (E) Mean firing rates over the 1 s stimulus for all cells at each stimulus strength.

