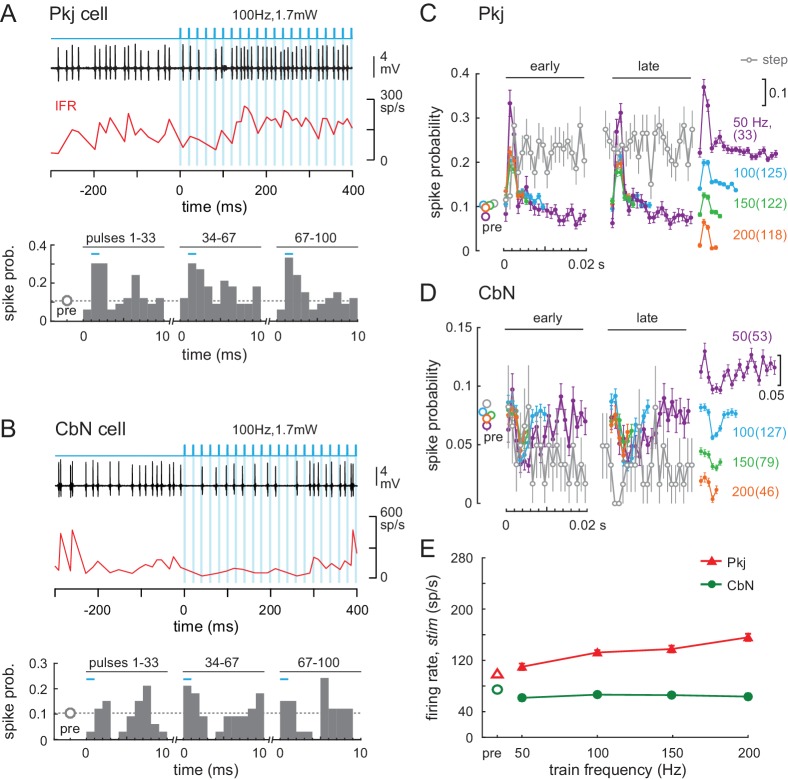
Figure 7. Effects of light trains on Purkinje and CbN cell firing.
(A, B) Top, Sample traces from a Purkinje (A) and CbN cell (B) in response to the first 400 ms of a 100 Hz light train (blue shading). Instantaneous firing rate (red, IFR). Bottom, Mean PSTH across cycles for the early (1-33), middle (34-67) and late (68-100) pulses in the train, showing resetting of spike times. Bin width, 1 ms; inter-pulse interval, 10 ms; pre, mean spike probability per 1 ms over a 1 s pre-stimulus epoch. (C, D) Mean PSTHs across all 35 Purkinje and 39 CbN cells for all train frequencies for early and late cycles analyzed as in (A) and (B). Far right, inset, PSTH traces from the early group at different frequencies are offset for clarity (scale = 0.1 change in spike probability). Grey open circles, PSTH of responses to light step (0.87 mW) from Figure 6, binned at 1 ms and overlaid for comparison; dotted grey line, mean pre-stimulus firing rates for all train conditions. (E) Mean firing rates over the 1 s stimulus for all cells at each frequency.
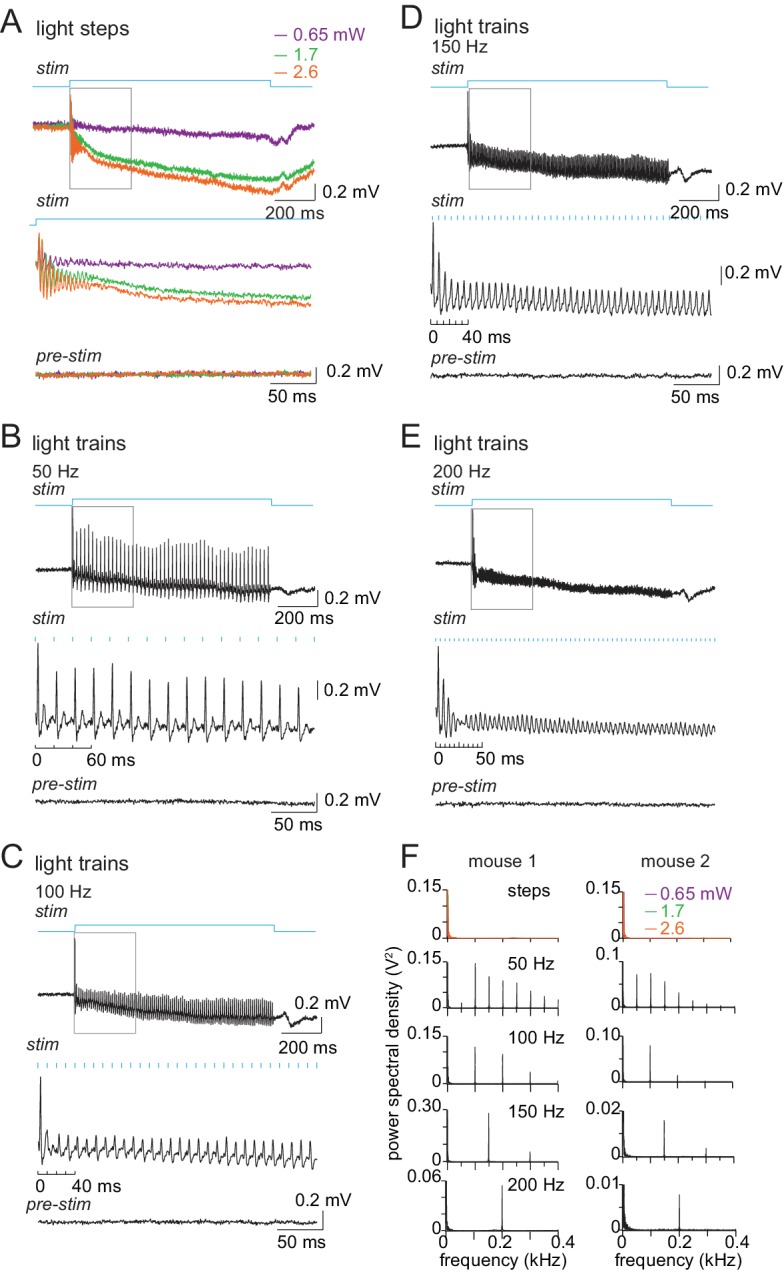
Figure 7—figure supplement 1. Local field potentials of Purkinje cell responses to optical stimulation.


