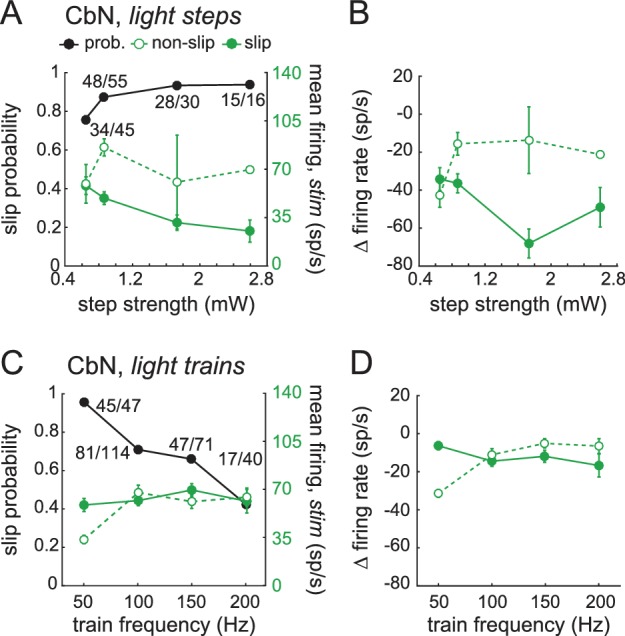
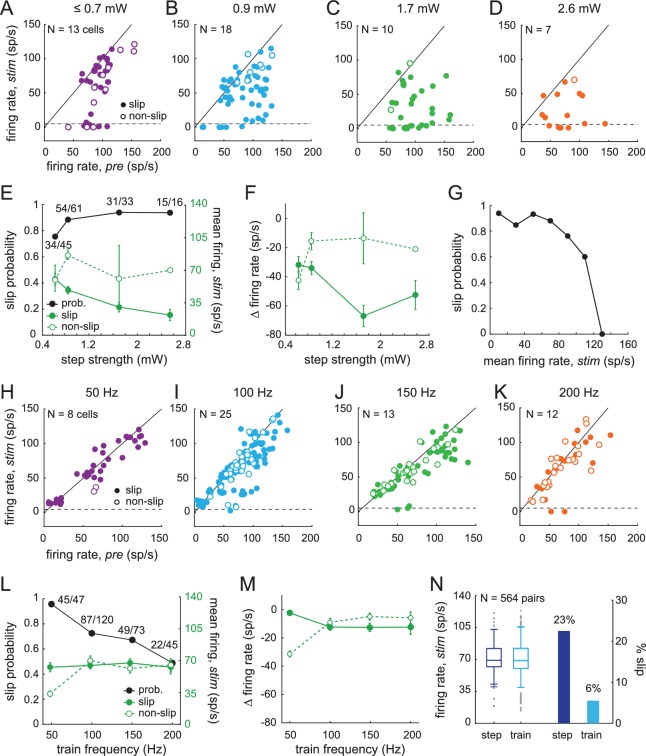
Figure 9. Sensitivity of smooth locomotion to optogenetic changes in CbN firing rates and patterns.
(A-D) Scatter plots for each light intensity of mean CbN cell firing rates during light steps (1 s) vs. pre-stimulus firing rates (1 s) for single trials. Filled symbols, slip; open symbols, non-slip trials; black line, unity; dashed line, five spikes/s. (E) Slip probability (black) and mean CbN cell firing rates (green) for slip (solid symbols) and non-slip (open symbols) trials. Numbers, slip/total trials (F) Change in CbN cell firing rates compared to pre-stimulus firing rates in slip and non-slip trials vs. light step strength. Symbols as in (E). (G) Slip probability vs. binned mean firing rates across all step intensities (bin = 20 spikes/s). (H–K) As in (A–D) for each light train frequency. (L) As in (E), for trains. (M) As in (F), for trains. (N) Left, Box plot of firing rates for 564 pairs of trials selected for similar mean firing rates during a step and a train of light stimuli applied to the same cell. Grey symbols, outliers; whiskers, two standard deviations. Right, Bar graph of fraction of paired trials in which a slip was evoked only by the step (dark blue) or only by the train (light blue).
Figure 9—figure supplement 1. Reanalysis of data of Figure 9 with slip measurements constrained to the period within the trial when locomotion was perturbed.


