. 2018 Mar 14;7:e34282. doi: 10.7554/eLife.34282

Figure 3. The effect of consubspecific PWD/PWD stretches of genomic sequence on pachytene synapsis, 2-chr cross.

Figure 3.

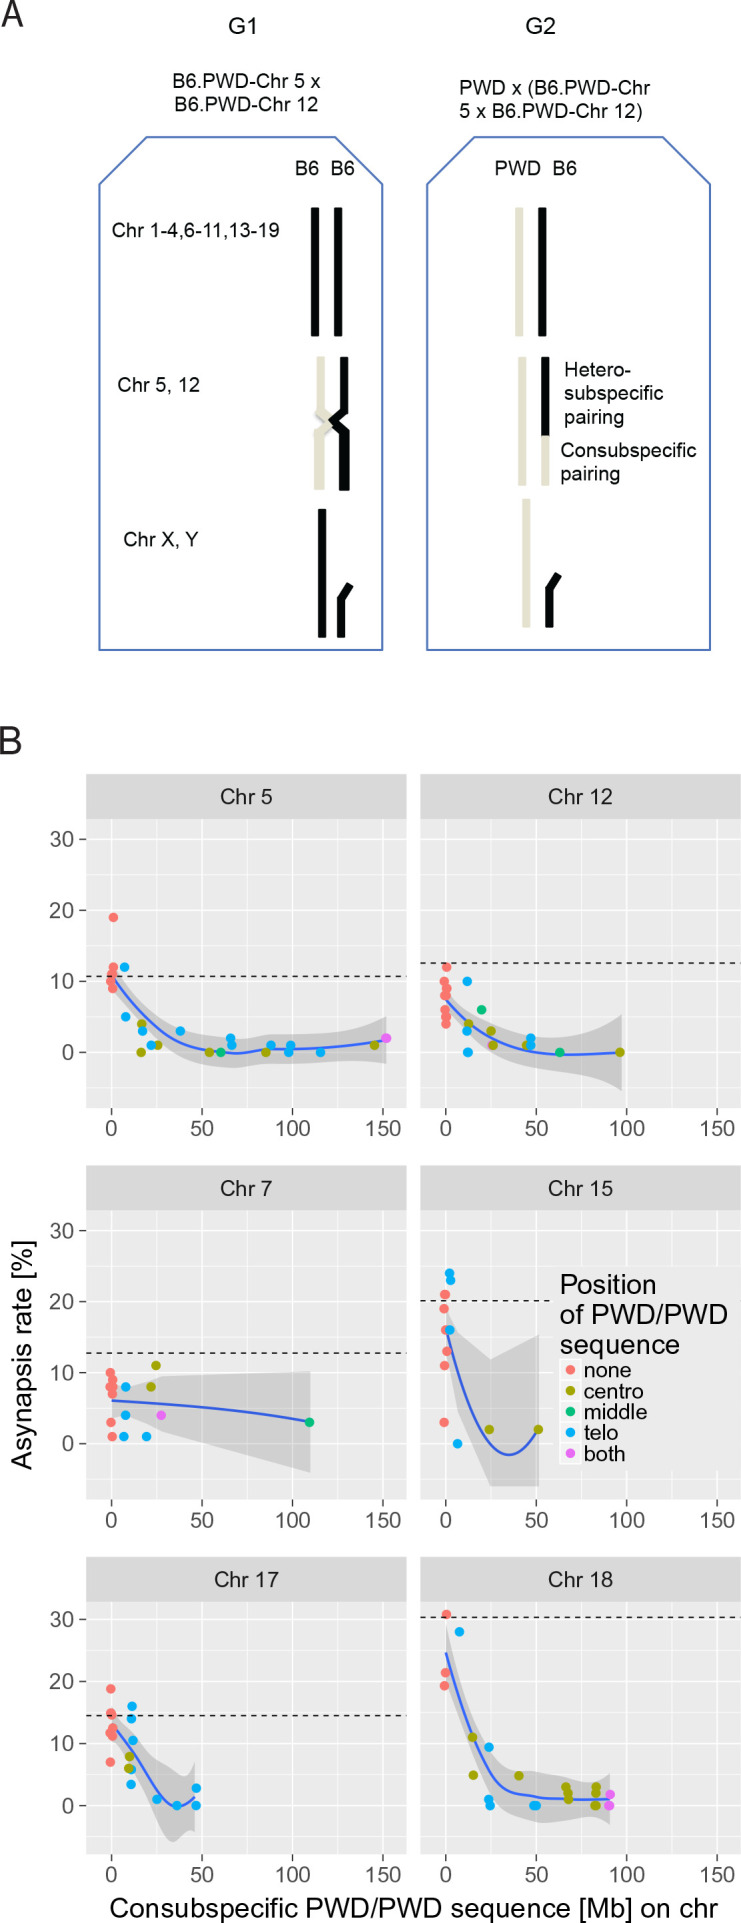
(A) The F1 hybrid males of two consomic strains (generation 1 G1, Chr 5 and Chr 12 shown here) were crossed to PWD females to produce generation 2 G2 sterile F1 hybrids with random recombinant consomic chromosomes 5 and 12. Using whole-chromosome probes, the asynapsis rate of the consomic chromosomes was scored by DNA FISH. (B) Combination of two chromosomes (5 + 12, 7 + 15 and 17 + 18) were challenged in each experiment. The localization of PWD homozygous sequence with respect to centromere, interstitial part of the chromosome or telomere, or on both ends is distinguished by color (see also Figure 3—source data 16). The average length between the minimum and maximum of the consubspecific sequence is plotted. The mean asynapsis rate of a given chromosome is regularly higher in PB6F1 hybrids (dashed line) than in 2-chr cross. For explanation see Figure 4 and the section on the trans-effect-dependent variation in asynapsis rate. Loess curve with 95% CI.

Figure 3—source data 1. The effect of the size and location of PWD/PWD consubspecific intervals on asynapsis of Chr 5.
DOI: 10.7554/eLife.34282.009
Figure 3—source data 2. The effect of the size and location of PWD/PWD consubspecific intervals on asynapsis of Chr 12.
DOI: 10.7554/eLife.34282.010
Figure 3—source data 3. The effect of the size and location of PWD/PWD consubspecific intervals on asynapsis of Chr 7.
DOI: 10.7554/eLife.34282.011
Figure 3—source data 4. The effect of the size and location of PWD/PWD consubspecific intervals on asynapsis of Chr 15.
DOI: 10.7554/eLife.34282.012
Figure 3—source data 5. The effect of the size and location of PWD/PWD consubspecific intervals on asynapsis of Chr 17.
DOI: 10.7554/eLife.34282.013
Figure 3—source data 6. The effect of the size and location of PWD/PWD consubspecific intervals on asynapsis of Chr 18.
DOI: 10.7554/eLife.34282.014
Figure 3—source data 7. Change point estimates of the minimal length [Mb] of PWD/PWD homozygosity showing detectable affect on synapsis rate.
DOI: 10.7554/eLife.34282.015
Figure 3—source data 8. Selected SSLP markers polymorphic between B6 and PWD.
DOI: 10.7554/eLife.34282.016