. 2018 Mar 29;7:e33417. doi: 10.7554/eLife.33417

Figure 1. Abnormal Ca2+ activities in mutant human RTT astrocytes.

(A) Pseudocolored Fluo4 fluorescence images from wild type (WT, left) and MeCP2 mutant (MT, right) astrocytes differentiated from human iPSCs. Green ellipses indicate astrocyte cell soma, while yellow rectangles indicate processes. Scale bars = 50 μm. (B) Representative ΔF/F0 traces showing the spontaneous intracellular Ca2+ activity from soma in (A). The black traces are from WT astrocytes and red traces are from MT ones. (C) Quantification of the percentage (left) of astrocytes showing spontaneous Ca2+ oscillations and the frequency (right) of such oscillations. (D) Trace of Fluo4 fluorescence changes in wild type (WT) and mutant (MT) human astrocytes stimulated by 10 μM ATP. Average traces are shown with the solid lines. (E) Quantification of the peak amplitude of the ATP-evoked Ca2+ elevations in wild type (WT) and mutant (MT) human astrocytes.

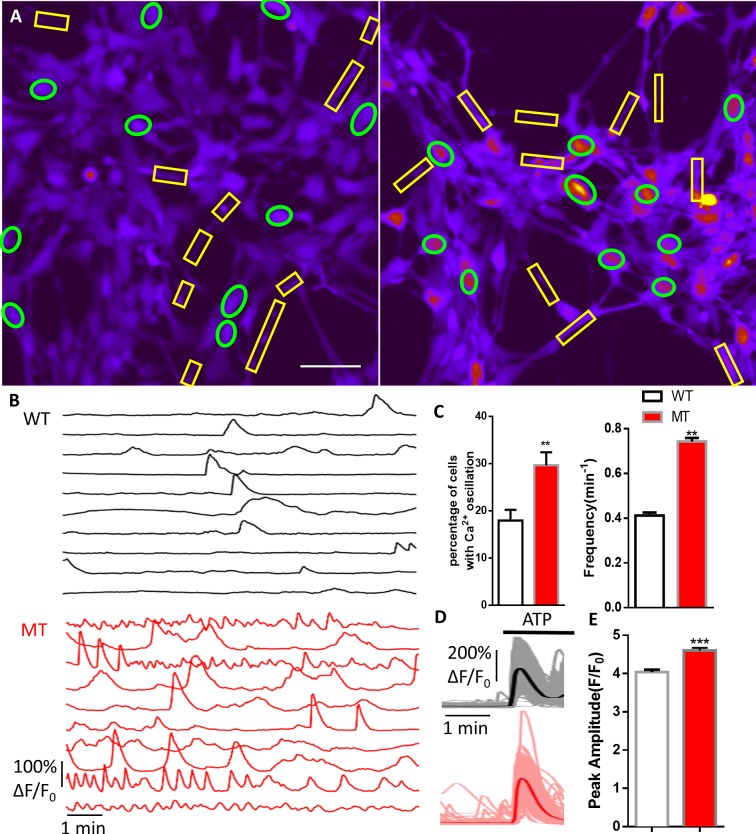
Figure 1—source data 1. The numerical data for the graphs shown in Figure 1C and E.
DOI: 10.7554/eLife.33417.011

Figure 1.

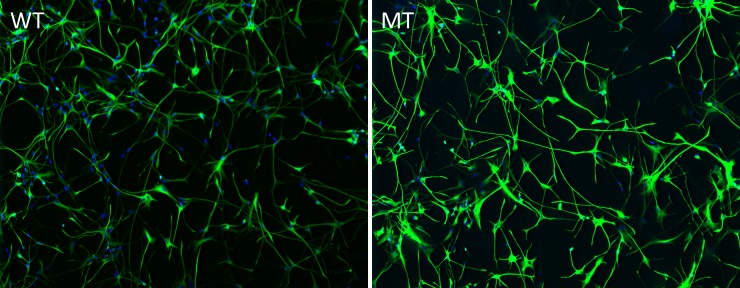
Figure 1—figure supplement 1. Representative images of quantification of astrocyte differentiation efficiency from human iPSCs by co-staining with GFAP (green) and DAPI (blue) followed by stereological analysis.

Figure 1—figure supplement 1.

On average, more than ~90% of the DAPI labeled cells are GFAP positive (See Table 1).
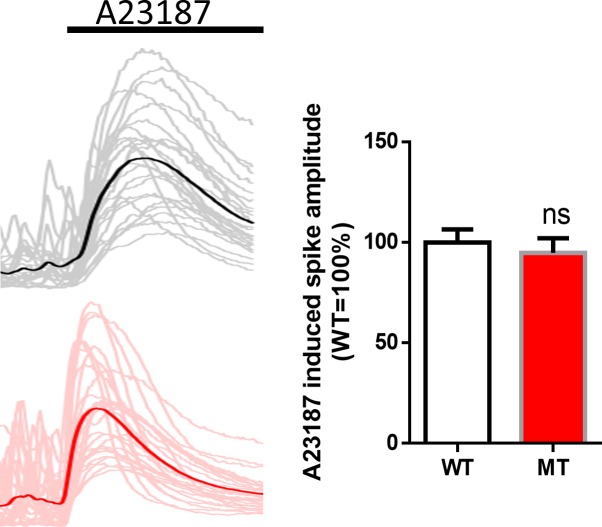
Figure 1—figure supplement 2. Ionophore A23187 induced Ca2+elevations from WT and MT astrocytes.

Figure 1—figure supplement 2.

Left, sample traces of Ca2 +elevation from WT (top) and MT (bottom) astrocytes. Average traces are shown in the solid line. Right, Quantification of the amplitude of A23187 induced Ca2 +elevations.
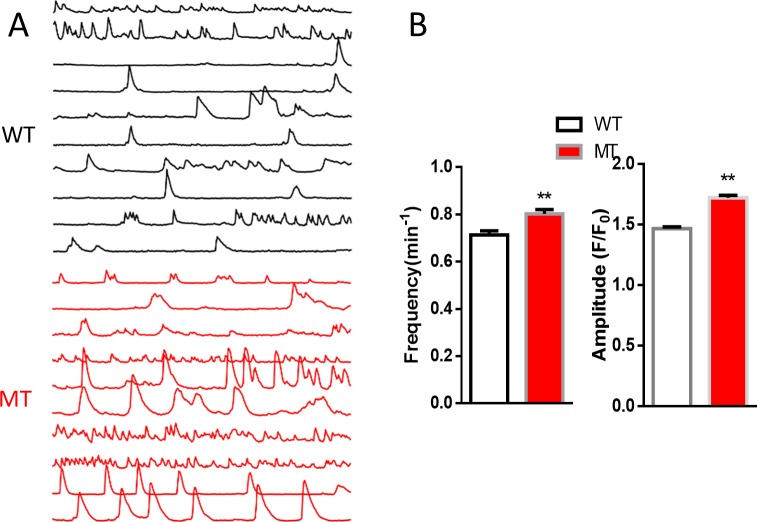
Figure 1—figure supplement 3. Spontaneous Ca2+ activity from processes of R294X wild-type (WT) and mutant (MT) human iPSC derived astrocytes.

Figure 1—figure supplement 3.

(A) Sample traces from WT and MT astrocytic processes marked by boxes in Figure 1A. (B) Quantification of the frequency (left) and amplitude (right) of the spontaneous Ca2 +activity from WT and MT astrocytic processes. **p<0.01.
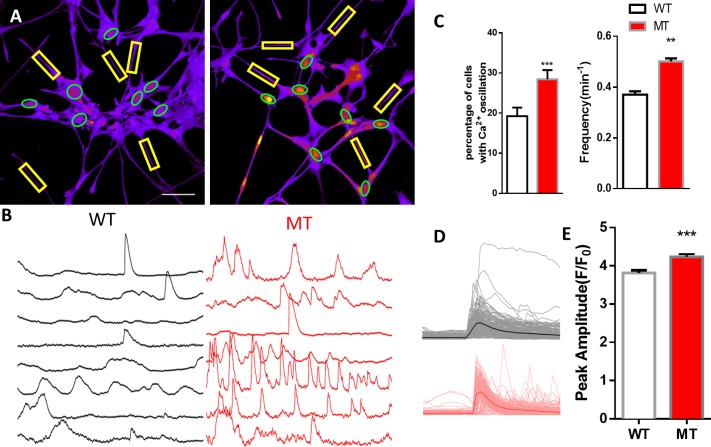
Figure 1—figure supplement 4. Abnormal spontaneous Ca2+ activities in V247fs mutant human RTT astrocytes.

Figure 1—figure supplement 4.

(A) Representative pseudocolored Fluo4 fluorescence images from wild type (WT, left) and MECP2 V247fs mutant (MT, right) astrocytes differentiated from human iPSCs. Green ellipses indicate astrocyte cell bodies, while yellow rectangles indicate processes. Scale bars = 50 μm. (B) Representative ΔF/F0 traces showing the spontaneous intracellular Ca2+ activity from the regions of interest (ROIs) in (A). The black traces are form WT astrocytes and red traces are from V247fs MT ones. (C) Quantification of the percentage (left) of astrocytes showing spontaneous Ca2+ oscillations, and the frequency (right). (D) All trace of Fluo4 fluorescence changes in wild type (WT) and V247fs mutant (MT) human astrocytes stimulated by 10 μM ATP. Average traces are shown with the solid lines. (E) Quantification of the peak amplitude of the ATP-evoked Ca2+ elevations in wild type (WT) and V247fs mutant (MT) human astrocytes stimulated by 10 μM ATP. The bar graphs in this figure show the mean ±s.e.m. **p<0.01, ***p<0.001.