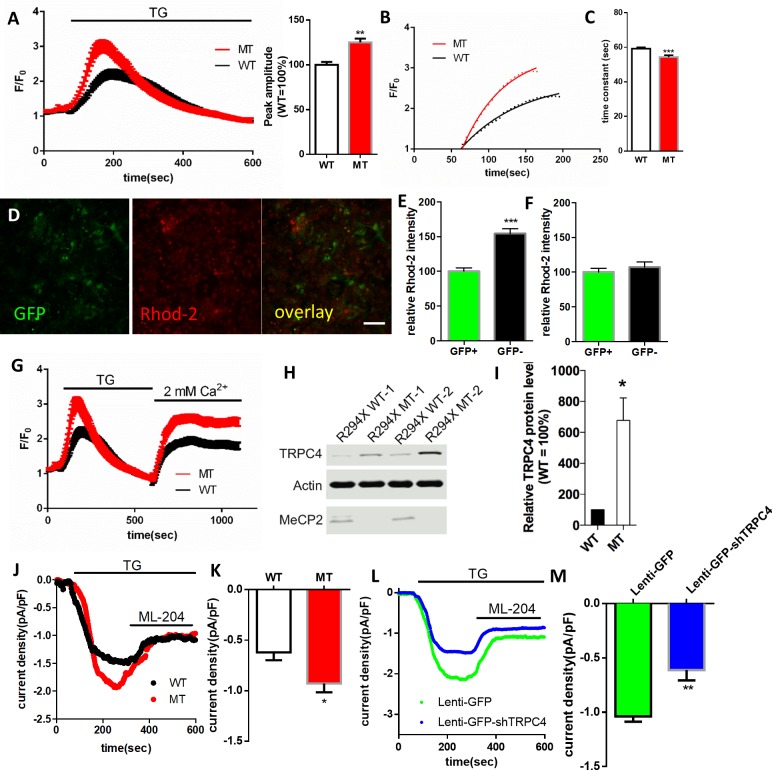
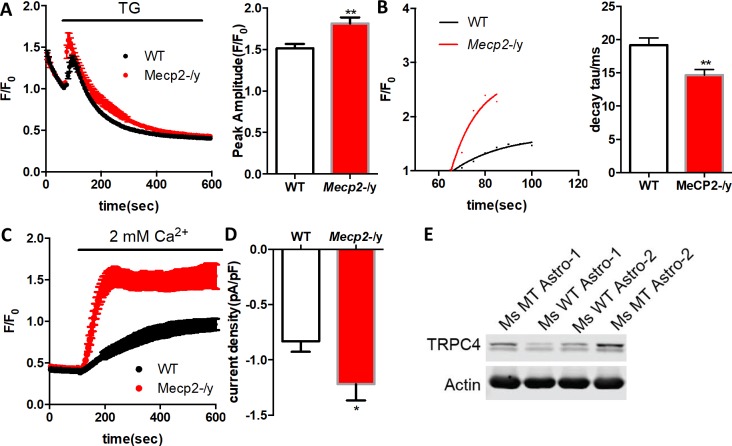
Figure 6. RTT astrocytes display abnormal calcium load in the ER, calcium leak from the ER, baseline cytosolic calcium level, and TRPC4-dependent SOCE.
(A) Left, average traces of Fluo4 fluorescence changes in wild type and mutant astrocytes treated with 1 μM TG to release ER calcium. Bath solution contained 0 mM Ca2+ plus 2 mM EGTA. Right, Quantification of the peak amplitude of TG induced Ca2+ elevations. (B) The rise phase (dots) shown in (A) is fitted with a single exponential curve. (C) Quantification of the time constant of the rise phase in the left panel from congenic mutant and wild type human RTT astrocytes in response to TG. (D) Representative GFP and Rhod-2 images in primary astrocytes from female Mecp2+/- ± with a GFP transgene on the wild type X chromosome. Scale bars = 50 μm. (E–F) Quantification of Rhod-2 fluorescence intensity in GFP negative and GFP positive primary astrocytes isolated from either female Mecp2+/- ± with a GFP transgene on the wild type X chromosome (E) or female Mecp2+/+ mice with a GFP transgene on the wild type X chromosome (F). (G) The average trace of Fluo4 fluorescence changes in response to extracellular Ca2+ (2 mM) after depletion of ER Ca2+ store using TG. (H) The Western blot result showing the protein level of TRPC4 in WT and MeCP2 mutant astrocytes. (I) Quantification of the Western blot results. (J) Representative traces of current density of TG-induced inward current in wild type and mutant astrocytes held at −70 mV. This current was partially blocked by TRPC4 selective antagonist, ML204. (K) Quantification of ML204 sensitive current from wild type and mutant astrocytes held at −70 mV. (L) Representative traces of current density of TG-induced inward current in mutant astrocytes infected with lentivirus expressing either GFP alone or co-expressing GFP and shTRPC4. (M) Quantification of ML204 sensitive current at −70 mV. The bar graphs in this figure show the mean ±s.e.m. *p<0.05, **p<0.01, ***p<0.001.
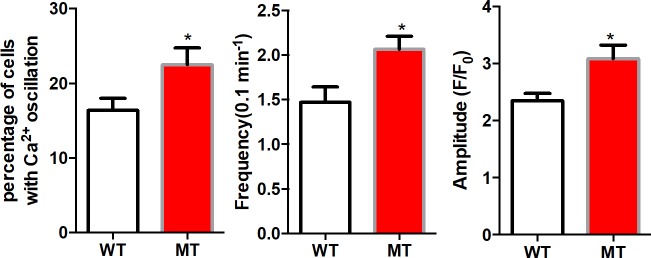
Figure 6—figure supplement 1. Mutant human RTT astrocytes exhibit abnormal Ca2+ activity in Ca2+-free aCSF (0 mM Ca2+ plus 2 mM EGTA).
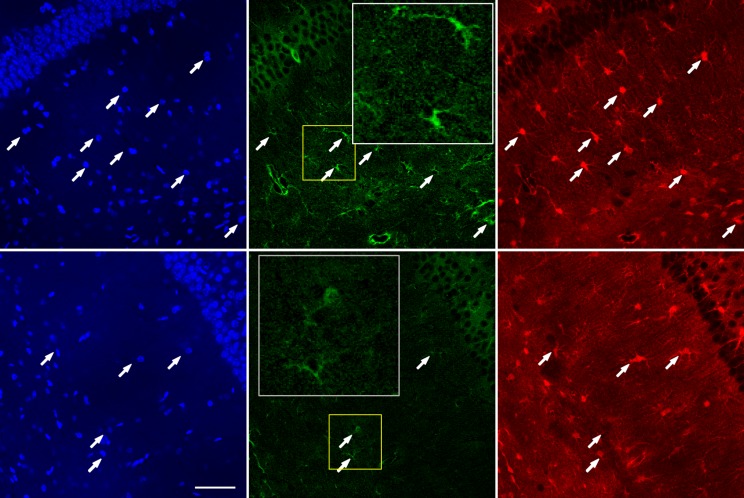
Figure 6—figure supplement 2. Co-staining of TRPC4 and astrocyte marker S100β on hippocampal sections from wild type (WT) and Mecp2 knockout (Mecp2-/y) mice.
Figure 6—figure supplement 3. ChIP-qPCR analysis of MeCP2 occupancy on the promoter of the TrpC4 gene in primary mouse astrocytes isolated from either Mecp2-Flag mice (Flag) or control mice (ctrl).
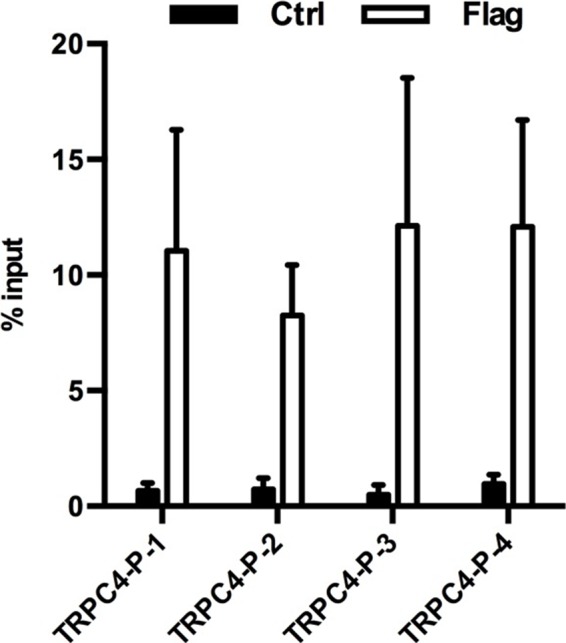
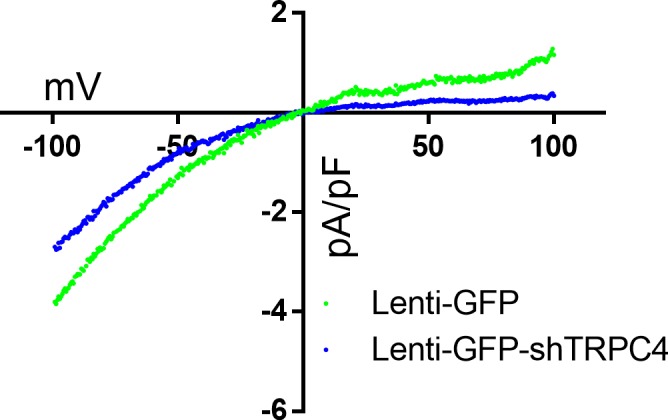
Figure 6—figure supplement 4. I-V curve of TG-induced ML204-sensitive current from astrocytes infected with Lenti-GFP or Lenti-GFP-shTRPC4.
