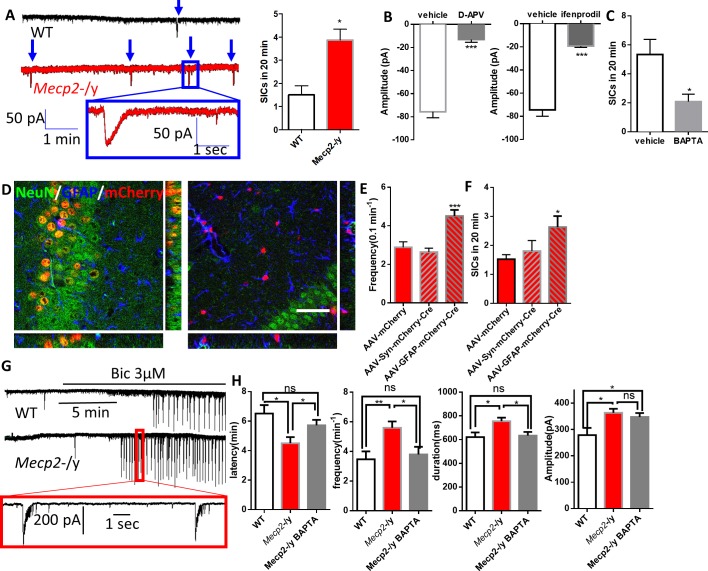
Figure 8. Abnormal Ca2+ activities in astrocytes lead to excessive activation of extrasynaptic NMDA receptors in neighboring neurons and increased network excitability.
(A) Left: representative traces of whole-cell patch clamp recording from CA1 pyramidal neurons in acute hippocampal slices prepared from wild type and Mecp2-/y mice showing slow inward currents (SICs). Arrows indicate all SICs. Inset: magnified view of the recording. Right: quantification of the SIC frequency in neurons from wild type and Mecp2-/y mice. (B) Quantification of the amplitude of SICs of neurons under control condition and in the presence of D-APV (left), an antagonist of NMDA receptors, or ifenprodil (right), a selective antagonist of NR2B-containing NMDA receptors. (C) Quantification of the SIC frequency in neurons adjacent to astrocytes with or without intracellular infusion of BAPTA. (D) Orthogonal (x-y view, y-z view, and x-z view) projections of z-scanning images showing immunofluorescence of NeuN and GFAP in regions around the hippocampus. The left image is from a Mecp2flox/y mouse injected with AAV-hSyn-mCherry-Cre, while the right image is from a Mecp2flox/y mouse injected with AAV-GFAP-mCherry-Cre. Note that all of the mCherry positive cells are NeuN positive in the left image, while all of the mCherry positive cells are GFAP positive in the right image. Scale bars = 50 μm. (E) Quantification of the frequency of the spontaneous Ca2+ oscillations in astrocytes from Mecp2flox/y mice injected with AAV-mCherry, AAV-hSyn-mCherry-Cre, or AAV-GFAP-mCherry-Cre. ***p<0.001 vs. AAV-mCherry. (F) Quantification of the SIC frequency from Mecp2flox/y mice injected with AAV-mCherry, AAV-hSyn-mCherry-Cre, or AAV-GFAP-mCherry-Cre. *p<0.05 vs. AAV-mCherry. (G) Representative patch clamp recordings in CA1 pyramidal neurons showing characteristic spontaneous epileptiform bursting activity in response to application of the GABAA-receptor antagonist bicuculline (3 μM) from wild-type (top) and Mecp2-/y (bottom) mice. (H) Quantification of the latency, frequency, duration and the amplitude of the epileptiform activity. The latency is defined as the time elapsed between Bic application and epileptiform activity onset. The bar graphs in this figure show the mean ±s.e.m. *p<0.05, **p<0.01, ***p<0.001.


