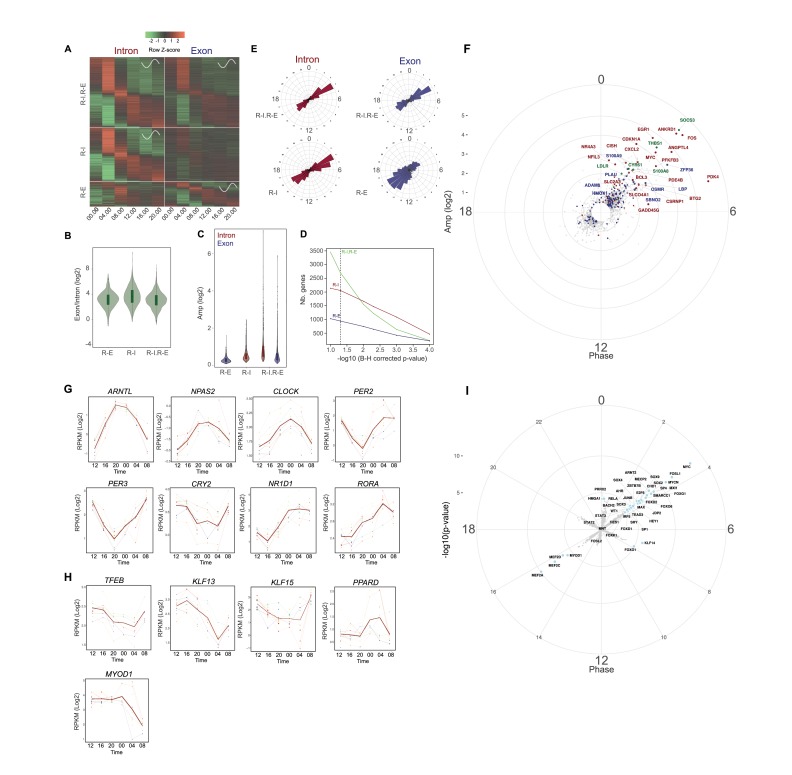
Figure 1. Rhythmic gene expression in human skeletal muscle.
(A) Heat map showing genes rhythmic at the pre-mRNA and mRNA level (R-I.R-E: upper panel), at the pre-mRNA level only (R-I: middle panel), and at the mRNA level only (R-E: lower panel). Standardized relative gene expression is indicated in green (low) and red (high) and ordered by their respective phase. (B) mRNA half-life proxy by exon/intron ratio showing lower stability for genes with rhythmic mRNA (R–E) profiles. (C) Amplitude distribution of genes that are rhythmic only at the mRNA level (R-E, blue), the pre-mRNA level (R-I, red), or rhythmic for both (R-I.R-E). Genes with higher amplitude of transcription at the pre-mRNA level have a higher probability to be rhythmic at the mRNA level (R-I.R-E). (D) Number of genes in each group in relation to the -log10 BH corrected p-value; dashed line indicates threshold of 0.05. (E) Phase distribution at the pre-mRNA and mRNA level for the three groups described in (A). (F) Phase distribution for genes activated by acute muscle exercise (red), inflammation (blue), or both (green). (G) Temporal expression of core clock components, and (H) key muscle transcription factors. N = 10 human muscle biopsy donors. (I) Phase distribution of predicted rhythmic DNA motif activity.


