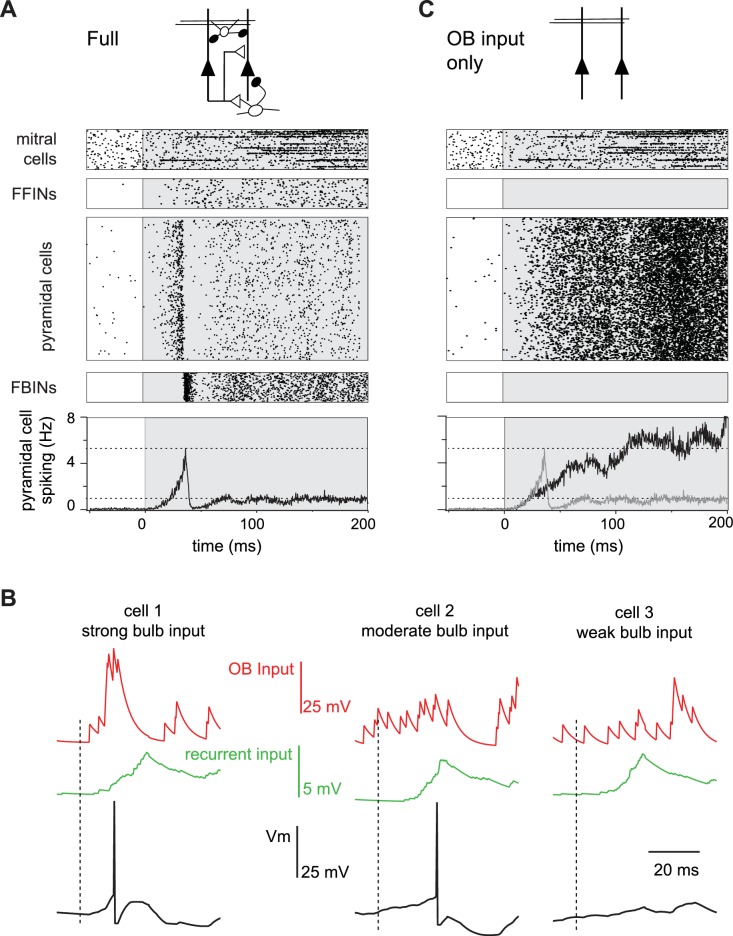
Figure 4. Evolution of a cortical odor response.
(A) Raster for a single sniff showing spiking activity of a subset of mitral cells (2250 out of 22,500), all 1225 feedforward neurons (FFINs), all 10,000 pyramidal cells, and all 1225 feedback interneurons (FBINs). Spiking rate for the population of pyramidal cells is shown at the bottom (average of six trials). Note that the earliest activated glomeruli initiate a cascade of pyramidal cell spiking that peaks after ~40 ms and is abruptly truncated by synchronous spiking of FBINs. Dashed lines show peak and steady-state firing rates during inhalation. (B) Single-trial voltage traces (black) for three pyramidal cells in response to the same odor. Inhalation onset is indicated by the dashed line. The red traces show OB input and the green traces the recurrent input received by each cell. Cell 1receives strong OB input and spikes soon after odor presentation. Cell 2 receives subthreshold input from OB and only spikes after receiving addition recurrent input from other pyramidal cells. Cell 3 receives no early odor-evoked input from the bulb, and its recurrent input is subthreshold, so it does not spike over the time period shown. (C) Raster plots for a reduced model in which pyramidal cells only get excitatory input from the OB, without FFI, recurrent excitation or FBI. Pyramidal cell spiking tracks mitral cell input. Population rate for the full network is shown in grey for comparison.

